Environmental Engineering Reference
In-Depth Information
120
100
80
60
40
20
0
0
2.2
4.5 6.7
Water vapor (vol%)
8.9
11.1
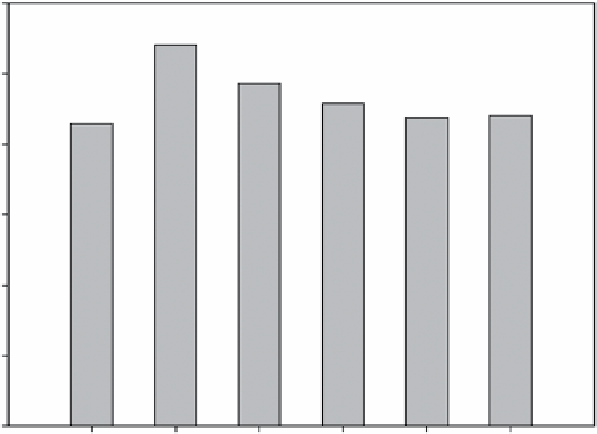
fiGure 21.14
Effects of water vapor on 15% CO
2
adsorption on CNT(ApTS) at 50°C. Courtesy from Environmental protection
Administration, ROC (Taiwan).
5.0
4.5
4.0
3.5
3.0
2.5
2.0
1.5
1.0
0.5
0.0
0
1
2
3
Water content (%)
4
5
6
7
fiGure 21.15
Effect of moisture on CO
2
adsorption of CT-30 at 298°C (gas flow rate, 50 ml min
-1
; CO
2
concentration, 2.0 vol%). Reprinted
with permission from Ref. [49]. © 2012, American Chemical Society.
+
−
CO RNH
+
+
ΗΟ ΝΗ
R
+
HCO
(21.7)
2
2
2
3
3
+
−
CO RNH
+
+
ΗΟ
R
ΝΗ
+
HCO
(21.8)
2
2
2
2
2
3
The decrease in
q
e
with the increase in water vapor percentage could be explained by the competitive adsorption between CO
2
molecules and water molecules at the same adsorption sites.
21.3.1.2.4 Effect of CO
2
Concentration
As mentioned earlier, the typical concentration of CO
2
in a flue gas discharge is on
the order of 5-50%. It is reported that with higher CO
2
concentrations, the adsorption capacity also increases (Fig. 21.16).
The CNT impregnated with TEpA, as reported by Ye et al., shows a CO
2
adsorption capacity of about 130.6 mg g
-1
sorbent at a
temperature and CO
2
concentration of 25°C and 2.0%, respectively (Fig. 21.17 and Table 21.2). Their work focuses on the requirement