Environmental Engineering Reference
In-Depth Information
12
DM
SIP
10
8
6
4
2
0
0
200
400 600
Tensile strain (%)
800
1000
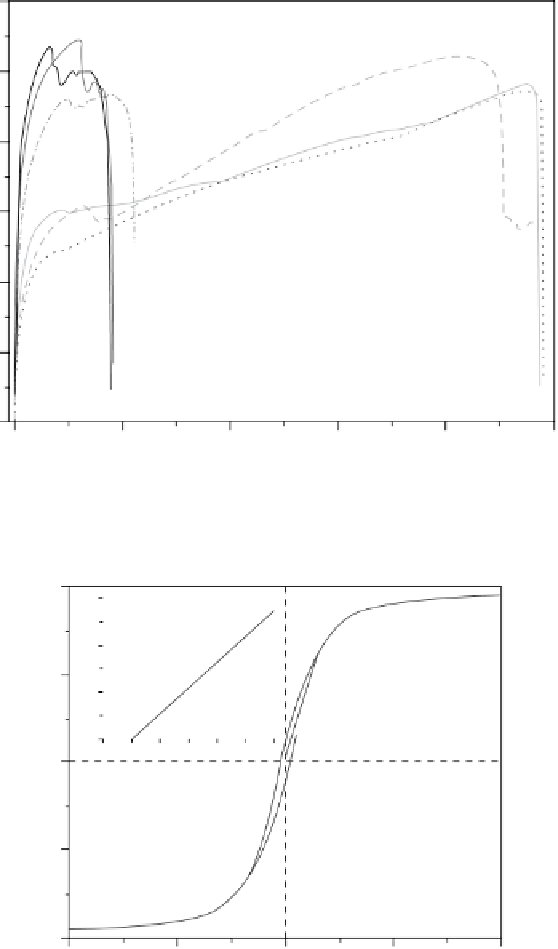
figure 4.5
Tensile stress-strain curves of 65 wt% nanocomposites fabricated by the DM and SIP methods; insets show the optical micro-
graphs of composites obtained using DM (left), pure polyurethane (middle), SIP (right). Adapted with permission from Ref. [16]. © IOP.
10
1.5
M
r
= 1.36 emu/g
1.0
5
496 Oe
0.5
0.0
-600
-400
-200
0
0
(a)
(b)
-5
MGNCs
-10
-20,000
-10,000
0
10,000
20,000
Magnetic eld (Oe)
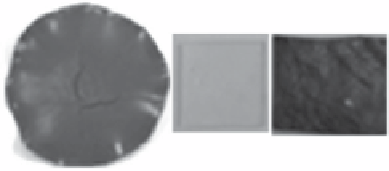
figure 4.6
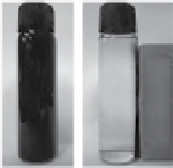
Room-temperature hysteresis loop of MGNCs. Top inset shows the enlarged partial curve and bottom inset shows MGNCs
dispersed in acid and magnetic separation. Adapted with permission from Ref. [25]. © ACS.
the MR properties of carbon nanostructure-derivatized PANI-based nanocomposites at two different temperatures; at the lower
temperature of 130 K, all samples demonstrated small, negative MR, while at the higher temperature of 290 K all samples
showed large, positive MR. This phenomenon indicated that at different temperatures, electron transport is affected differently
by the external magnetic field, which further indicates that at different temperatures, electron transport takes place via different
mechanisms.
4.3.4
rheological analysis of Multifunctional nanocomposites
Dispersion of nanofillers in a polymer or carbon matrix may have a significant impact on the rheological behavior, which
subsequently affects the processing and properties of multifunctional nanocomposites. The difference in rheological behavior
can in turn provide insights into the structural variations of nanofillers in host polymer or carbon matrix. The characteristic