Environmental Engineering Reference
In-Depth Information
(a)
(b)
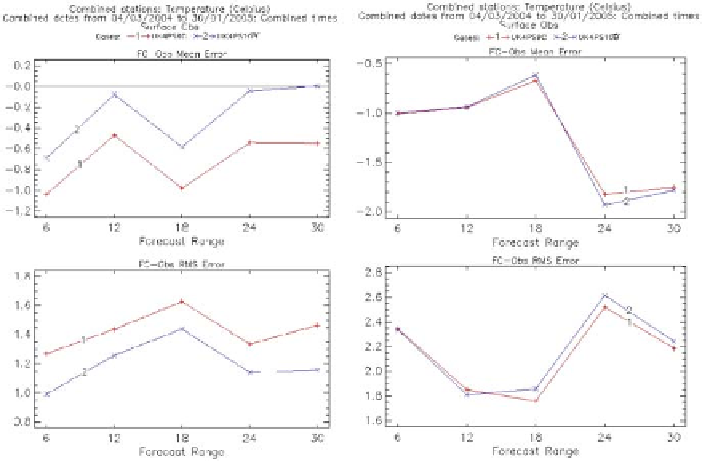
Fig. 9.5
Impact on forecasts of 'screen' temperature over 21 cases of including anthropogenic
heat source in the operational 4 km UM
(a)
at a dense urban site (London Weather Centre) and
(b)
a very remote rural site.
line 1
is without,
line 2
with the heat source,
top
frames are bias,
bottom
RMS error
This source is deliberately conservative. It ignores the contribution of transport and
is based on national energy use statistics, distributed uniformly over the urban land-
use. Figure 9.5 shows the results from a trial over 21 representative cases of incorpo-
rating the anthropogenic heat source. A substantial improvement in bias and RMS
error in screen temperature forecasts were produced at the few urban sites that are
routinely monitored.
The system does a reasonable job of predicting UHIs, substantially better than
the simple 'rough concrete' approach (Best et al., 2006). However, extensive testing
against surface data from various cities has revealed limitations. The first is the spec-
ification of the roughness length for heat. Figure 9.6 (Fig. 3 from Best et al. 2006)
shows the sensitivity to changes in z0t/z0m. This is usually set to 0.1 over vegetated
terrain. The smaller value in urban areas arises because of the large contribution of
bluff body pressure forces to the momentum flux. This contributes to the amplitude
of turbulence but not to the surface scalar flux. This arises naturally out of more
fundamental approaches based on canopies or canyons, but has to be specified in
the simpler approaches adopted here. It is evident from Fig. 9.6 (and other results in
Best et al., 2006) that, while the model can be adjusted to give sensible magnitudes
of the terms in the SEB, it is difficult to produce good phase behaviour, especially
for the sensible heat flux around dusk and (to a lesser extent) dawn.
Search WWH ::

Custom Search