Environmental Engineering Reference
In-Depth Information
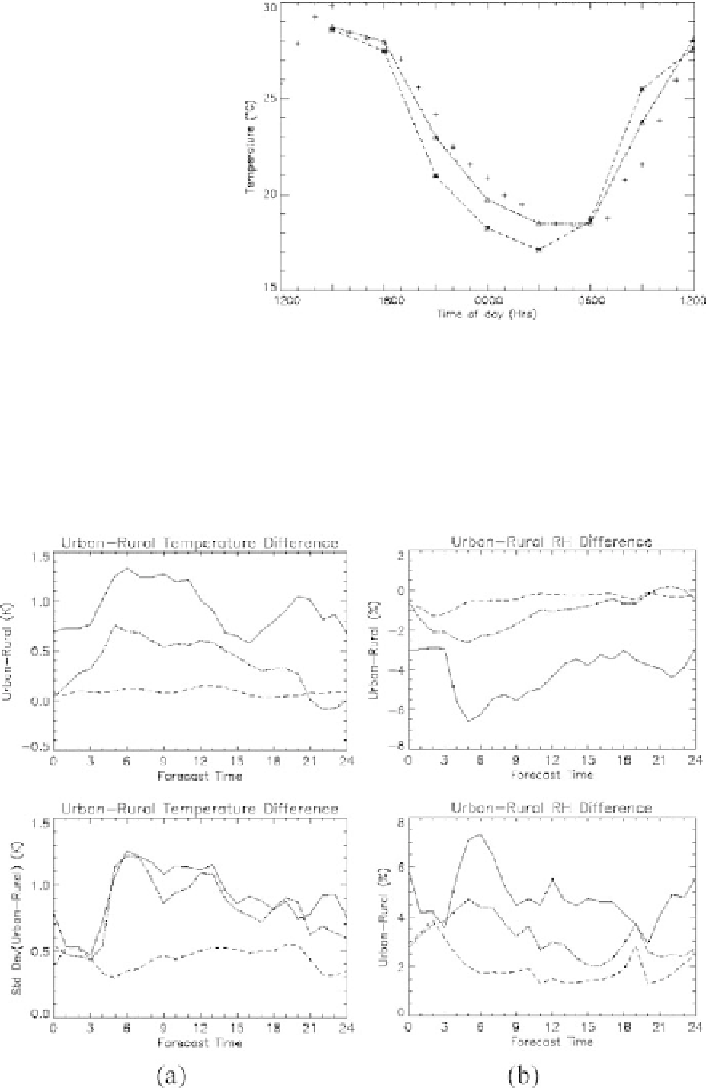
Fig. 9.2
Screen-level
temperature for London from
12UTCon30Julyto12UTC
on 31 July 1999. Crosses:
synoptic observations for the
London Weather Centre;
dashed line: traditional soil
scheme for representing
urban areas; and dashed dot
line: canopy scheme for
representing urban areas (Fig.
9 from Best, 2005)
the impact of phase lags introduced by storage within building materials. In essence,
the traditional surface energy balance is split. The SEB drives the change of temper-
ature of a homogeneous block, intended to represent the thermal inertia of building
materials. This block is then radiatively coupled to the soil surface. This is a small
change structurally but has a significant beneficial impact Figure 9.2 (Fig. 9 from
Fig. 9.3
Mean and standard deviation of
(a)
temperature and
(b)
relative humidity difference
between Heathrow (largely urban) and Beaufort Park (largely rural). Observed (
solid
), Mesoscale
model (
dashed
), SSFM (
dot-dashed
) over all 12 UTC forecasts from November and December
1997 and January 1998
Search WWH ::

Custom Search