Environmental Engineering Reference
In-Depth Information
5m/s
5m/s
122500
122500
TP
303
302
301
300
299
120000
120000
117500
117500
298
297
296
295
294
115000
115000
112500
112500
110000
110000
107500
107500
845000
850000
855000
845000
850000
855000
X
X
(a)
(b)
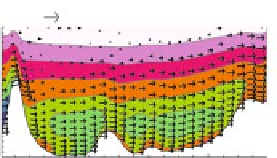
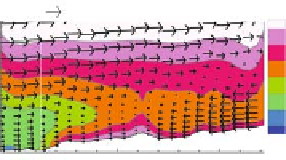
Fig. 6.9
City influence on the low level fields: (
a
) potential temperature (colours) and wind
(vectors) at 1300 UTC (June 25, 2001) at 7.5 m above ground level (G2 domain), actual situa-
tion; (
b
) alternate simulation without the city (see text) - the white lines indicate the positions
of Fig. 6.10 vertical cross-sections and the numbers indicate those of Fig. 6.11 vertical profiles
(See also Colour Plate 10 on page 175)
actual situation, coupled with the thermal internal boundary layer development. At
the same location, the atmosphere is clearly convective with the city, but slightly sta-
ble without (Fig. 6.11), showing the importance of city characteristics in numerical
simulations.
5m/s
(u,w)
y = 115030 m North
5m/s
(u,w)
y=115030mNorth
TP
301
300
299
298
297
296
295
500
500
400
400
300
300
200
200
100
100
0
0
845000
850000
855000
850000
X
855000
845000
East
West
East
X
West
5m/s
5m/s
(v,w)
x
=
846610 m East
(v,w)
x = 846610 m East
500
500
400
400
300
300
200
200
100
100
0
0
110000
115000
120000
110000
115000
120000
North
South
South
North
Y
Y
(a)
(b)
Fig. 6.10
(
a
) Vertical W-E (
top
)andS-N(
bottom
) cross-sections of the atmospheric boundary
layer potential temperature and wind fields - same situation as Fig. 6.9, actual situation; (
b
)alter-
nate simulation without the city. The white lines indicate the position of Fig. 6.11 city centre
vertical profiles (2 and 4) (See also Colour Plate 11 on page 175)


Search WWH ::

Custom Search