Environmental Engineering Reference
In-Depth Information
300
4
295
2
0
290
-2
285
-4
0
5
10
15
20
0
5
10
15
20
Hours
Hours
(b)
(a)
Fig. 6.7
Layout influence on local climatology the Rezé site for July 1996: (
a
) mean surface tem-
perature diurnal cycle (
b
) surface temperature increment if July had been dry, for the same layout
(
continuous line
), with vegetation watering one hour per evening (
dashed line
), with pavement
replaced by grass (
dash-dot line
), with natural grounds replaced by pavement (
dash-dot-dot line
)
intensive observation period. The simulations for the actual situation and for an
alternate situation without the city are compared (Figs. 6.9, 6.10 and 6.11) for mid-
day June 25th 2001. The simulations were performed on the three nested domains
(Fig. 6.8) with physiography from IGN (French national geographical institute)
urban data base BDTopo for the G2 domain and from the Corine Land Cover out-
side. In the alternate situation, the urban area is replaced with the natural “garrigue”,
a low, sparse and dry vegetation.
The main differences between the simulations are observed in the first hundred
metres above ground over the most urbanised areas, i.e. located on the west side of
the west-east cross-section and at the centre of the south-north one (Figs. 6.9 and
6.10). The cold air carried by the south-west sea breeze is lifted by the urban ther-
mals and roughness, while it penetrates further inland in the alternate simulation,
showing the competition between large scale flow and local cover influence. As
a consequence, in sea breeze conditions midday is characterized by a temperature
increase from the coast to the land (Figs. 6.9 and 6.10) with a higher gradient in the
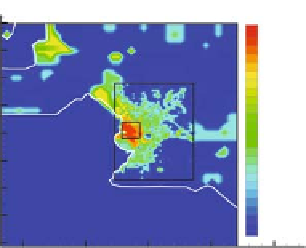
densite batie
densite batie
bat
0.6
0.575
0.55
0.525
0.5
0.475
0.45
0.425
0.4
0.375
0.35
0.325
0.3
0.275
0.25
0.225
0.2
0.175
0.15
0.125
0.1
0.075
0.05
0.025
0
bat
0.6
0.575
0.55
0.525
0.5
0.475
0.45
0.425
0.4
0.375
0.35
0.325
0.3
0.275
0.25
0.225
0.2
0.175
0.15
0.125
0.1
0.075
0.05
0.025
0
Topography (m)
135000
Berre
pond
(G1)
650
600
550
500
450
400
350
300
250
200
150
100
50
40
30
20
10
8
6
4
2
1
0
130000
130000
Etoile Massif
125000
125000
(G2)
120000
120000
Huveaune
Valley
(G3)
115000
115000
"L a G a rd e "
Hill
S
t
Cyr
Hill
110000
110000
105000
105000
Marseilleveyre
massif
100000
Puget
Massif
100000
Mediterranean
Sea
95000
95000
830000
840000
850000
860000
870000
830000
830000
840000
840000
850000
850000
860000
860000
870000
870000
X(m)
X
(a)
(b)
Fig. 6.8
Marseille area (
a
) topography and (
b
) building density. Black rectangles indicate the three
computational grid limits, G1 (990 m mesh), G2 (330 m) over the urban area and G3 (110 m) over
the city centre (See also Colour Plate 9 on page 175)


Search WWH ::

Custom Search