Environmental Engineering Reference
In-Depth Information
with Re
∗
for three different urban sites from previous field experiments were inter-
compared. Surprisingly, even though surface geometry differed from site to site, the
regressed function agreed with data from the three urban sites as well as with the
COSMO data. Field data showed that
B
-1
values decreased as the areal fraction of
κ
vegetation increased (Fig. 5.2).
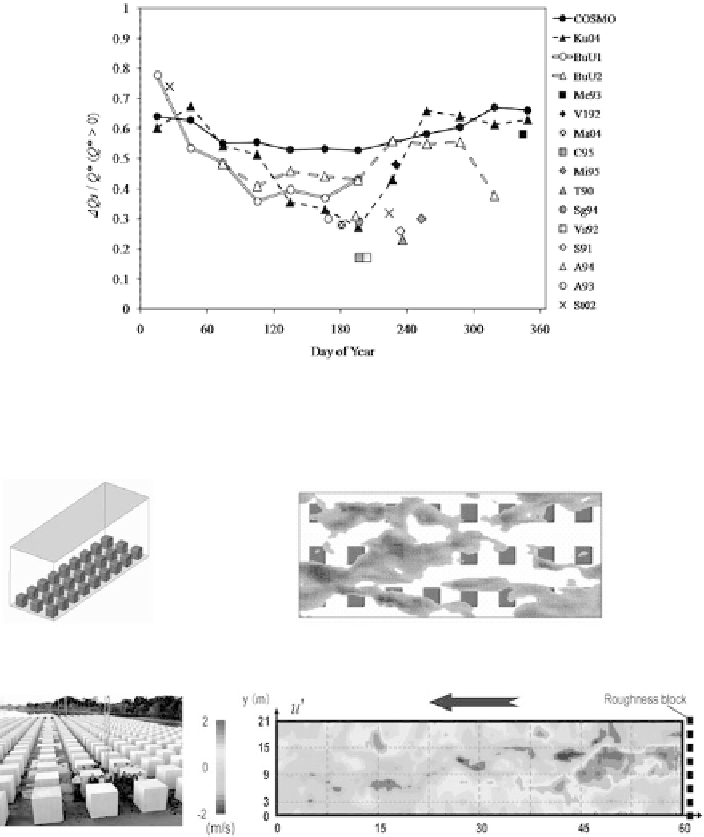
The surface energy balance data obtained from COSMO for one year is useful
to interpret the observed values in real cities. It is surprising that the heat storage
Fig. 5.3
The seasonal trend of
dQ
s
/
Q
∗
. The values of COSMO and various cities are plotted
together
Fig. 5.4
Turbulent organized structures
(a)
simulated by LES (from Kanda, 2006a) and
(b)
observed in COSMO (from Inagaki and Kanda, 2006).
Grey region
are so called low speed streaks
defined as the region where horizontal velocity fluctuation from the horizontal mean is negative
Search WWH ::

Custom Search