Environmental Engineering Reference
In-Depth Information
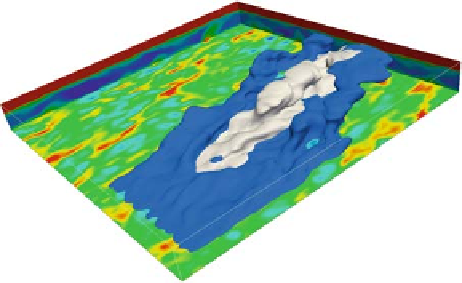
Fig. 2.2
Instantaneous
contour plot of the
concentration fields for the
two emission scenarios (64%
in
blue
and 16% in
grey
)after
two hours of simulation and
with a threshold of 0.1 ppb.
The potential temperature is
also shown as coloured
surfaces (See also Colour
Plate 4 on page 172)
An instantaneous contour plot of the concentration fields for the two emission
scenarios after two hours of simulation is shown in Fig. 2.2. The two plumes gener-
ated by the two emission patterns can be distinguished (blue and grey contours). The
contours show clearly the squared shape of the emission pattern and its advection to
the right of the domain.
The simulation runs for 2 h after a pre-run of 1 h for the dynamics only. The
scalars have no initial concentrations in the atmospheric boundary layer (ABL).
They are emitted from the surface with an emission rate of 0.1 ppb s
−
1
. Statistics
are calculated for the last hour.
Using FVM we simulate the same ABL over the same domain, but using a hori-
zontal mesh of 2
2 grid cells. The code is initialized with the results of the pre-run
of 1 h performed by LES.
Let us assume that within a RANS grid cell of 5
×
5km
2
(coinciding with the
×
LES sub-domain size with a resolution of 100m
100m) we have a source with
finite dimensions. The normal practice would be to average the emission from the
source over the grid cell size and to use it as source term to solve the average concen-
tration equation in order to account for the atmospheric dispersion. In our case, we
take into account the variability of the source by including (2.2) into (2.1) and solv-
ing (2.1). The emission variances are calculated from the high-resolution emission
inventory (used for the LES simulation); the parameter from
r
is deduced from the
LES simulation and the concentration variance is calculated in a straight-forward
manner.
×
2.4 Results
Figure 2.3 shows the result of the comparison between the LES variance and the
RANS model variance for the 64% Emission Surface/Grid-Cell scenario in the four
sub-domains. The agreement in the sub-domain where the emission takes place is
excellent. However, results deteriorate for the other cells where the variances are
Search WWH ::

Custom Search