Environmental Engineering Reference
In-Depth Information
5m/s
(u,w)
y = 115030 m North
5m/s
(u,w)
y=115030mNorth
TP
301
300
299
298
297
296
295
500
500
400
400
300
300
200
200
100
100
0
0
845000
850000
855000
850000
X
855000
845000
East
West
East
X
West
5m/s
5m/s
(v,w)
x
=
846610 m East
(v,w)
x = 846610 m East
500
500
400
400
300
300
200
200
100
100
0
0
110000
115000
120000
110000
115000
120000
North
South
South
North
Y
Y
(a)
(b)
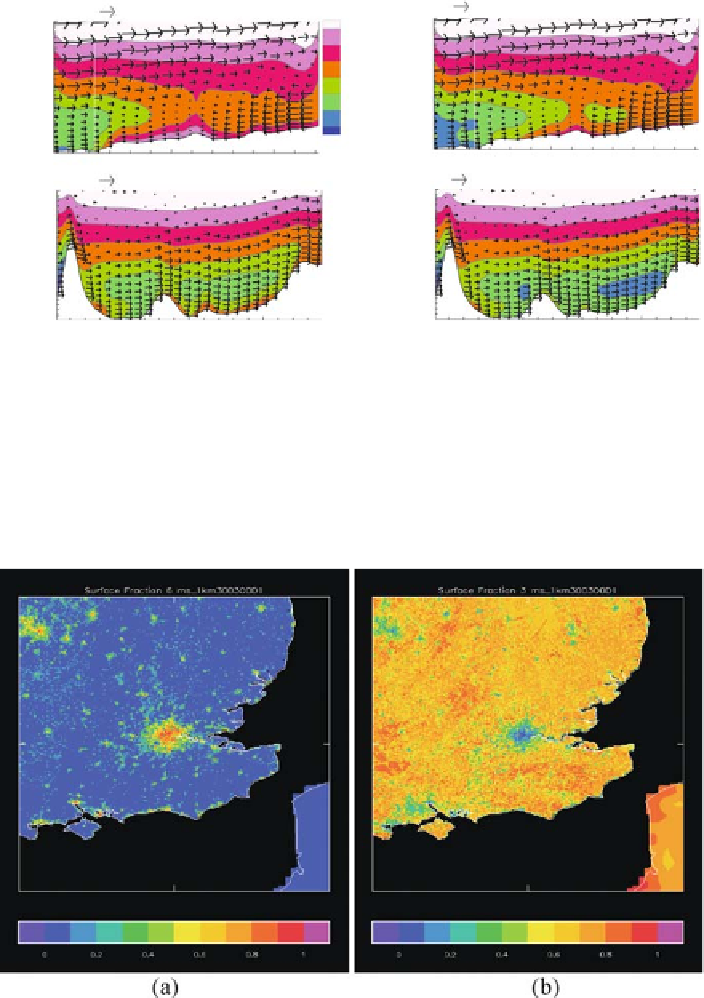
Plate 11
(
a
) Vertical W-E (
top
)andS-N(
bottom
) cross-sections of the atmospheric boundary
layer potential temperature and wind fields - same situation as Fig. 6.9, actual situation; (
b
) alter-
nate simulation without the city. The white lines indicate the position of Fig. 6.11 city centre
vertical profiles (2 and 4) (See also Figure 6.10 on page 55)
Plate 12
Land-use fraction at 1 km resolution over SE England (centred on London) derived from
CEH data
(a)
urban
(b)
C3 grass (i.e. grass and crops) (See also Figure 9.1 on page 79)
Search WWH ::

Custom Search