Environmental Engineering Reference
In-Depth Information
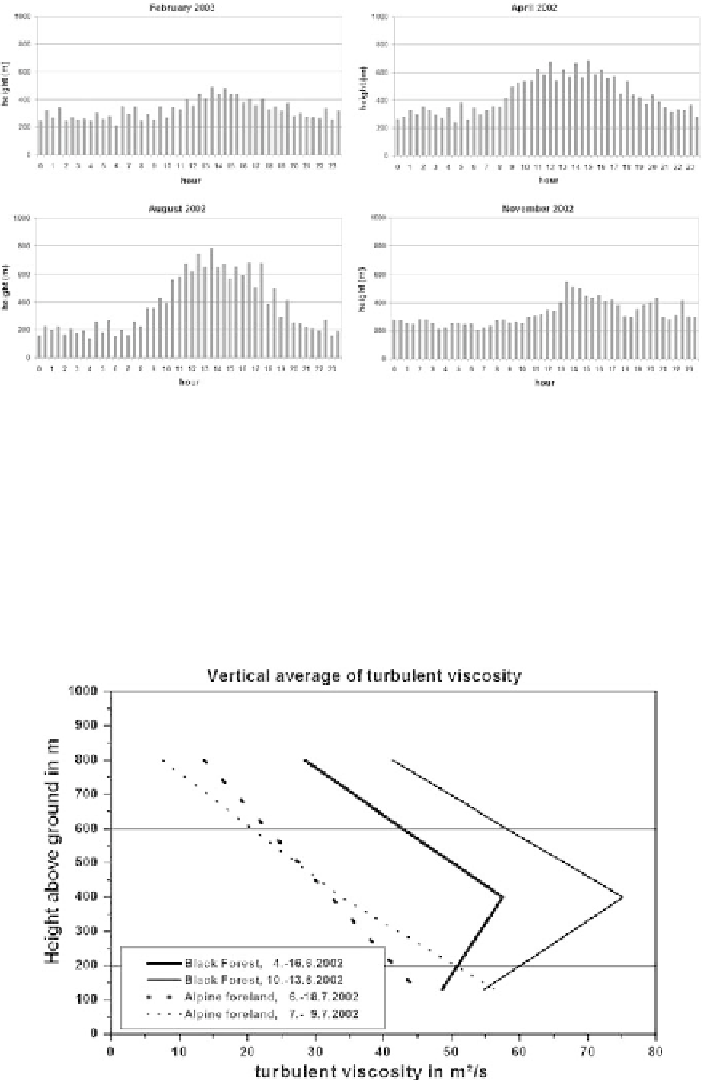
Fig. 13.6
Mean diurnal variation of mixing layer height over Hannover for four months from
sodar data (from Emeis and Türk, 2004)
Only the latter quantity is directly available from sodar measurements. For the pro-
files shown in Fig. 13.7 the vertical turbulent momentum flux has been assumed
to be proportional to the variance of the vertical wind component. Details of the
determination of the turbulent viscosity are given in Emeis (2004b).
Fig. 13.7
Estimated vertical profiles of the vertical turbulent exchange coefficient over level and
highly complex terrain from sodar measurements (from Emeis, 2004b)
Search WWH ::

Custom Search