Environmental Engineering Reference
In-Depth Information
(b)
(a)
2000
2000
1600
1600
1200
1200
800
800
400
400
0
0
10
20
30
40
048 2 6
Wind speed (m/s)
Virtuel Potential
Temperature (C)
(c)
(d)
(e)
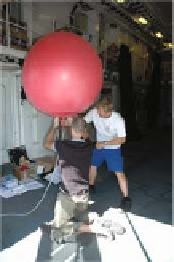
Fig. 12.6 (a)
Ceilometer (
arrow
) mounted on the research ship Galathea;
(b)
An example of
boundary layer structure measured by the ceilometer during the Galathea expedition. The darker is
the colour the higher is the particle concentration.
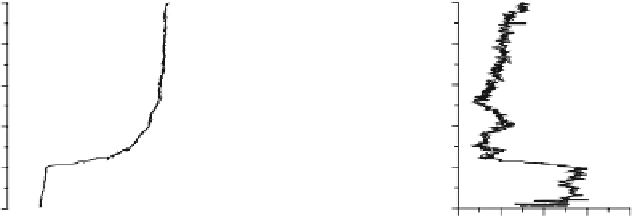
(c, e)
Radiosonde profiles taken with
(d)
during
thesameevent
potential temperature and a simultaneous decrease of the wind speed from 11 to 3
ms
−
1
, ideal conditions for the formation of waves (Fig. 12.6).
12.3 Conclusions
Examples of the use of remote sensing with relevance to the urban areas are pre-
sented. The technique offers possibility to measure the horizontal variability of the
mean wind in the roughness sub-layer over an urban area as well as the wind pro-
file at a specific location. These can add valuable insight into the structure of the
urban boundary layer. The use of remote sensing to estimate the depth of the marine
boundary layer has proven to be very successful. Radiosounding is still an indis-
pensable tool in boundary layer research adding valuable information not available
from other instruments.
Acknowledgments
The authors thank Ebba Dellwik for the figures from the forest campaign.
The work is related to activities of the authors within COST-728, COST-732, and COST-735.


Search WWH ::

Custom Search