Environmental Engineering Reference
In-Depth Information
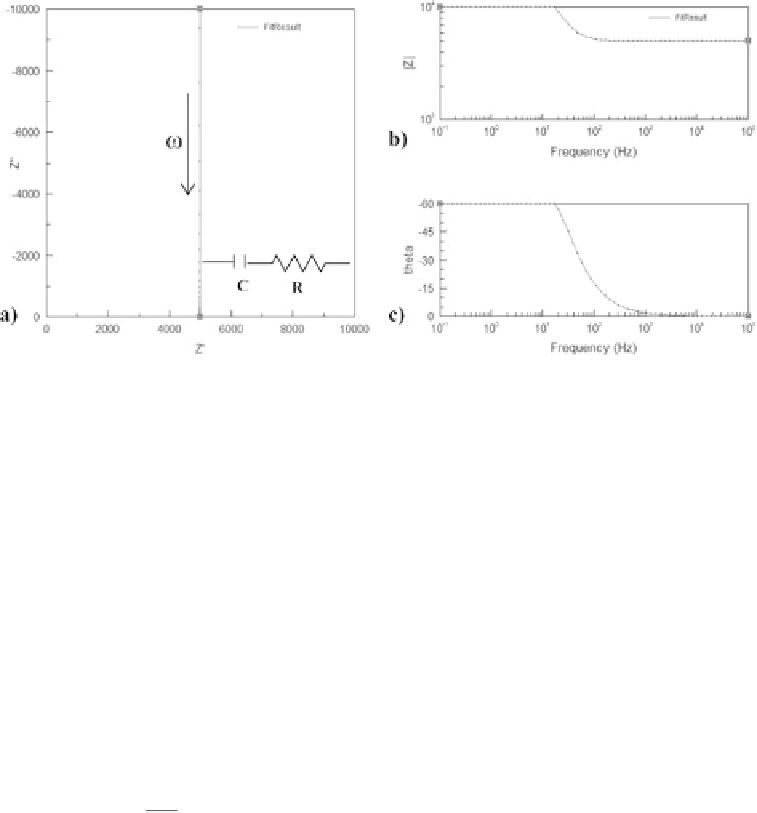
Figure 10.3.7
Graphical representation of the AC impedance of a capacitor in series with a resistor:
(a) Nyquist diagram; (b) impedance Bode diagram; and (c) phase Bode diagram.
ω
is the
radial frequency;
C
=
1
µ
F and
R
=
5k
.
i
being the number of circuit elements. Thus, for an electrochemical reaction the total
impedance may be defined as:
1
Z
=
(10.3.11)
1
/R
+
jωC
The corresponding Nyquist diagram, presented in Figure 10.3.8, shows a semicircle
with diameter
R
. The extension of the semicircle, therefore, provides useful informa-
tion concerning the reaction kinetics of the system: facile reaction kinetics will show a
small diameter, while a blocking electrode will be characterized by a huge semicircle.
Finally, the time constant of the reaction kinetics,
τ
, is given by:
1
τ
=
1
RC
ω
max
=
(10.3.12)
where
ω
max
is the radial frequency at the semicircle maximum (Figure 10.3.8). The
high-frequency intercept of the semicircle is zero, while the low-frequency intercept of
the impedance semicircle is
R
.
10.3.3 EIS analysis of PEC cells for water-splitting
Photoelectrochemical cells for water-splitting have been extensively characterized by
the well-known Mott-Schottky relation, which allows obtaining the flat-band potential
and the donor density by plotting the inverse square route of the space charge capac-
itance as a function of the applied potential. The capacitance is usually determined
by fitting the experimental data to a simple resistor-capacitor (RC) electrical ana-
logue assembled in parallel - Figure 10.3.9a. In fact,
C
1
in Figure 10.3.9a corresponds

Search WWH ::

Custom Search