Environmental Engineering Reference
In-Depth Information
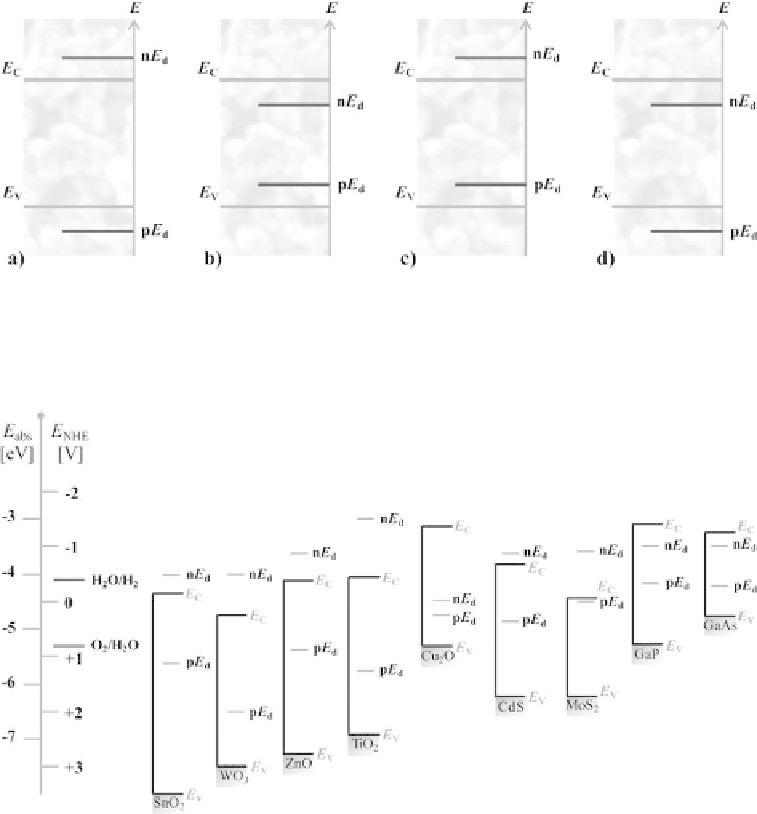
Figure 10.2.7
Relative positions of decomposition Fermi Levels of a semiconductor with respect to its
band edges: a) cathodically and anodically stable, b) cathodically and anodically unstable,
c) cathodically stable but anodically unstable and d) anodically stable but catodically
unstable. Adapted from ref (Gerischer, 1977).
Figure 10.2.8
Positions of band edges and decomposition Fermi levels for different oxide and non-oxide
semiconductors at pH 7. Adapted from (Memming, 2001).
The energy positions of the electron-induced potential
n
E
d
and the hole-induced
corrosion value
p
E
d
can be plotted with respect to the band edges
E
c
and
E
v
, as shown in
Figure 10.2.7. In fact, the criterion for thermodynamic stability of the semiconductor is:
p
E
d
> E
redox
>
n
E
d
(10.2.13)
Figure 10.2.8 shows some decomposition potentials for various semiconductors used
to carry out the water-splitting reaction under solar radiation. However, these dia-
grams show some practical limitations since, besides the thermodynamic stability, the
reaction kinetics may also play an important role in the stability definition of a given
Search WWH ::

Custom Search