Information Technology Reference
In-Depth Information
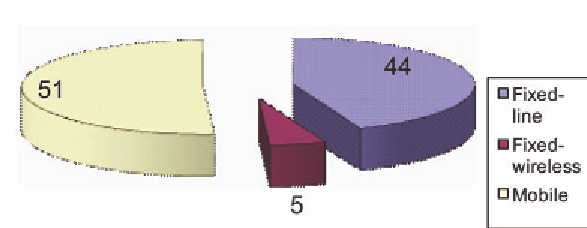
Figure 2. Broadband market share by access technology
as YouTube, MySpace, etc) which are bandwidth
intensive by nature.
Figure 2 illustrates the current split of broad-
band users between fixed-line (Telkom), fixed-
wireless (iBurst) and mobile (MTN & Vodacom)
providers. It is evident that the mobile broadband
providers occupy the lion's share (51%) of the
market, followed by Telkom's ADSL service
(44%) and lastly iBurst's 5% market share. This
is something of an anomaly in an international
context. In contrast, Point-Topic (2009) reveals
that, globally, fixed-line providers dominate the
residential broadband market (with a two thirds
majority), primarily owing to considerably lower
cost structures and enhanced economies of scale.
This is further discussed in the following section
of this chapter.
Table 3 provides a year-on-year tally of the
number of broadband users in South Africa.
The decreasing growth rate doesn't necessar-
ily provide cause for concern. The low base
somewhat flatters growth in the early years, with
the size of the broadband base at least doubling
on an annual basis until 2008. That said, whilst
the market is experiencing a promising growth
rate in percentage terms at the time of writing, it
should be acknowledged that the growth is based
on a very small pool of users. By taking into ac-
count the shrinking base of dial-up users discussed
above, it may be safely inferred that a migration
is occurring. However, the gains to the broadband
user base outweigh the losses to the dial-up user
base, suggesting that more South African are
connecting to the Internet as they see the advan-
tageous of broadband connectivity.
Double counting remains a problem though as
a particular user may have fixed-line broadband
at home and a 3G account for mobile broadband
whilst travelling. Likewise, the number of broad-
band subscribers is unlikely to equate exactly to
the number of broadband users as an entire fam-
ily might share a single ADSL connection. To a
limited extent, these two effects do counteract
one another.
According to the latest statistics by Goldstuck
(2009), of the 48 million South African residents,
only 4.5 million (9.4%) have Internet access and
fewer than four people per hundred have access
to broadband services. The following section now
compares South Africa's performance relative to
the rest of the world - considering both developed
and developing nations.
Table 3. Growth of broadband subscribers
Year
Subscribers (growth rate)
2003
15 700
2004
51 500 (228%)
2005
175 200 (240%)
2006
392 000 (123%)
2007
818 000 (108%)
2008
1 352 000 (65%)
Source: Goldstuck (2009)


Search WWH ::

Custom Search