Information Technology Reference
In-Depth Information
Table 1. Before broadband (Internet access between 1993 and 2003)
Year
1993 1994 1995 1996 1997 1998 1999 2000 2001 2002 2003
Average ISP
costs
80.00
80.00
80.00
80.00
80.00
80.00
88.00
89.00
90.00
94.00
100.00
Year on year
increase
0.00%
0.00%
0.00%
0.00%
0.00% 10.00%
1.14%
1.12%
4.44%
6.38%
Telekom (10
hours)
60.06
66.67
88.01
97.69
111.38
141.53
168.62
184.93
201.24
287.61
323.71
Telekom (20
hours)
85.91
94.57
131.78
145.79
173.17
218.82
264.62
295.93
327.24
485.25
546.19
Telekom (40
hours)
137.62
150.39
219.33
241.99
296.74
373.41
456.62
517.93
579.24
880.53
991.15
Year on year
increase
9.89% 40.91% 10.55% 19.74% 26.23% 21.27% 12.24% 10.91% 49.26% 12.56%
Total (10 hours)
140.06
146.67
168.01
177.69
191.38
221.53
256.62
273.93
291.24
381.61
423.71
Total (20 hours)
165.91
174.57
211.78
225.79
253.17
298.82
352.62
384.93
417.24
579.25
646.19
Total (40 hours)
217.62
230.39
299.33
321.99
376.74
453.41
544.62
606.93
669.24
974.53 1091.15
Year on year
increase
5.36% 23.11%
6.82% 13.21% 18.57% 18.49%
9.70%
8.84% 40.48% 11.66%
Source: Internet.org.za (2003)
sites remained unaffected. Telkom have subse-
quently reversed this policy and applied a 'hard
cap' meaning that all Internet connectivity is
terminated once the cap has been reached. Local
bandwidth is no longer unlimited and is charged
on a per gigabyte basis after the pre-assigned
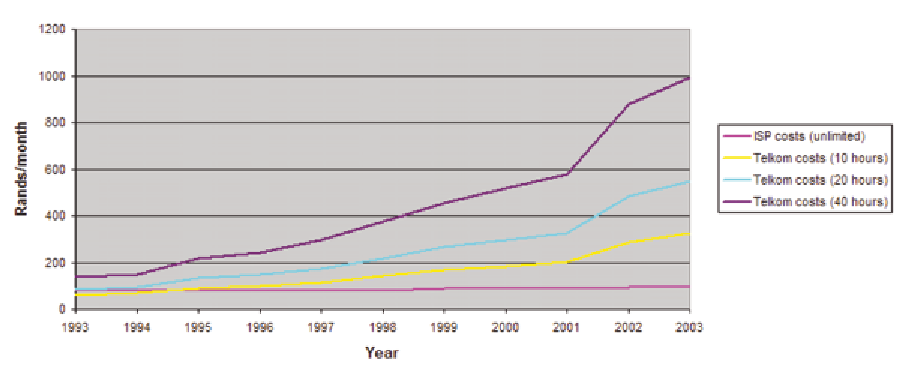
Figure 1. A graphical representation of Internet access costs between 1993 and 2003 (Source Internet.
org.za (2003))


Search WWH ::

Custom Search