Information Technology Reference
In-Depth Information
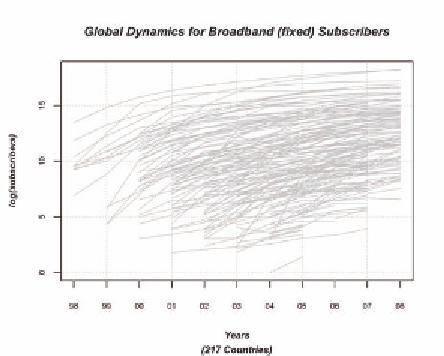
Figure 3. Global dynamics for broadband (fixed) subscribers
around the world, a disaggregate level study of
individual countries appears to be more appropri-
ate to understand the underlying dynamics and
the causes behind the variation. However, since
such detail study is beyond the scope of this
chapter, we focus our analysis of penetration
behavior to a small subset of selected countries.
To facilitate our understanding of the phenom-
ena observed in the last section (Figures 1 to 2),
this chapter examines 10 countries, 5 of which
were ranked in the top 5 for penetration rate in
2002 and the rest ranked in the top 5 in 2008.
Using the time series data from 1999-2007,
we use functional data analysis (Ramsay and
Silverman, 1997) to estimate the velocity and
acceleration rates for BB penetration (per 100
inhabitants). This analysis is restricted to the ten
countries discussed above. The Figure 3 display
the plots of estimated velocities and accelerations
of penetration per 100 inhabitants for selected 10
countries where the 'velocity' implies the “veloc-
ity for growth” or rate of change in penetration
with respect to time and 'acceleration' measures
the rate of change of growth velocity or growth
rate of penetration (in short, the change in mo-
mentum). These velocity and acceleration rates
are estimated by first fitting a smooth function to
the observed time series of BB penetration data
and then differentiating the function twice (see
appendix B for details).. The subtle features (e.g.,
the bumps and dips) observed in the derivative
plots are not visible in the time series plots shown
in Figures 1 and 2.
More specifically, Figure 4 and 5 display the
estimated velocities and Figure 6 display the
estimated acceleration rates of penetration for
10 selected countries. Due to missing data, for
countries that are ranked in the top five for pen-
etration rate in 2002(namely Hong Kong, Korea,
Taiwan, Iceland and Canada), we used data for
the time period 1999-2007. For countries that
are ranked in the top five for penetration rate in
2008 (Norway, Denmark, Switzerland, Sweden
and Netherland), we used data from 2000-2007.
It is clear from the Figure 4 that in spite of the
year over year increase in BB penetration for
countries Korea, Taiwan, Iceland, Canada and
Hong Kong (who were pioneers in BB penetration
early in this decade) their penetration velocity is
on a declining path. However, the change points
for these five countries are different. Korea,
Taiwan and Hong Kong, experienced significant
declines in their penetration velocity beginning
the very first year of the sample period used in
our estimation whereas Taiwan and Iceland ex-
perienced growth in velocity until 2002 and 2006
Search WWH ::

Custom Search