Information Technology Reference
In-Depth Information
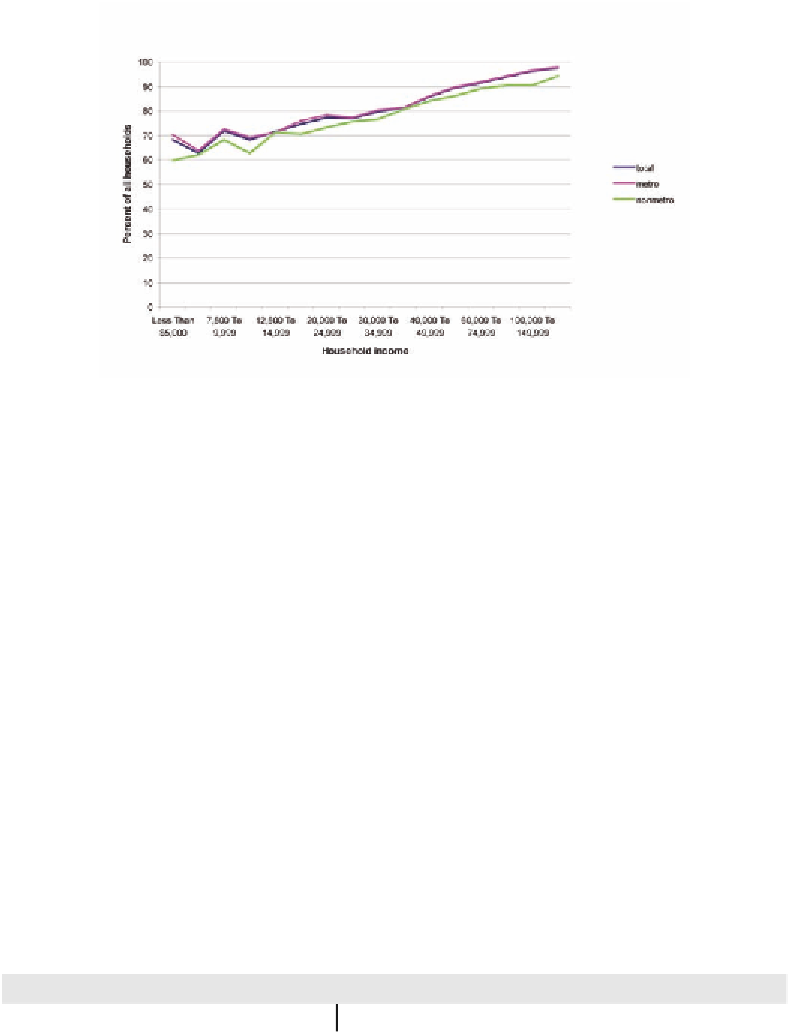
Figure 5. Internet users with household connection by income 2007 (Source authors using CPS data)
A marked drop-off in broadband access exists
between urban and rural residents, even in the
Northeast. Only 70 percent of rural residents with
in-home Internet access have broadband access
as compared to 85 percent of urban residents. The
data suggest that broadband availability is an is-
sue for rural areas across the country.
Broadband access rates do not diverge much
when taking into consideration persons or house-
holds (Table 8). This lack of variation between
household and individual broadband access rates
suggests that once the household dynamic helps
determine whether the household will have in-
home access, the household dynamic no longer
matters greatly in deciding in favor of, or against,
taking the next step, having broadband access.
The broadband rural-urban dichotomy is more
readily apparent when household income is taken
into account (Figure 6). The relationship shown
in Figure 6 suggests that income is not much of
a factor in opting for broadband over dial-up for
an in-house Internet connection. The gap between
rural and urban household use of broadband con-
nections thus would suggest that broadband avail-
ability is more of a challenge for rural than urban
households unless there is some systemic differ-
ences between rural and urban households that
otherwise could explain the gap. The systemic
household dissimilarity, if it exists, would have
to explain why rural households are as likely as
urban households using the Internet but do not
Table 7. Percent of on-line persons with home broadband access, 2007
Metropolitan (percent)
Nonmetropolitan (percent)
Total (percent)
Northeast
88.1
68.5**
86.1
Midwest
83.8
72.3**
81.5
South
83.8
66.7**
81.0
West
85.8
76.9**
85.1
Total
85.2
70.2**
83.1
Source: authors using CPS data.
Note: Difference between metro/nonmetro (** -- significant at 0.01).


Search WWH ::

Custom Search