Information Technology Reference
In-Depth Information
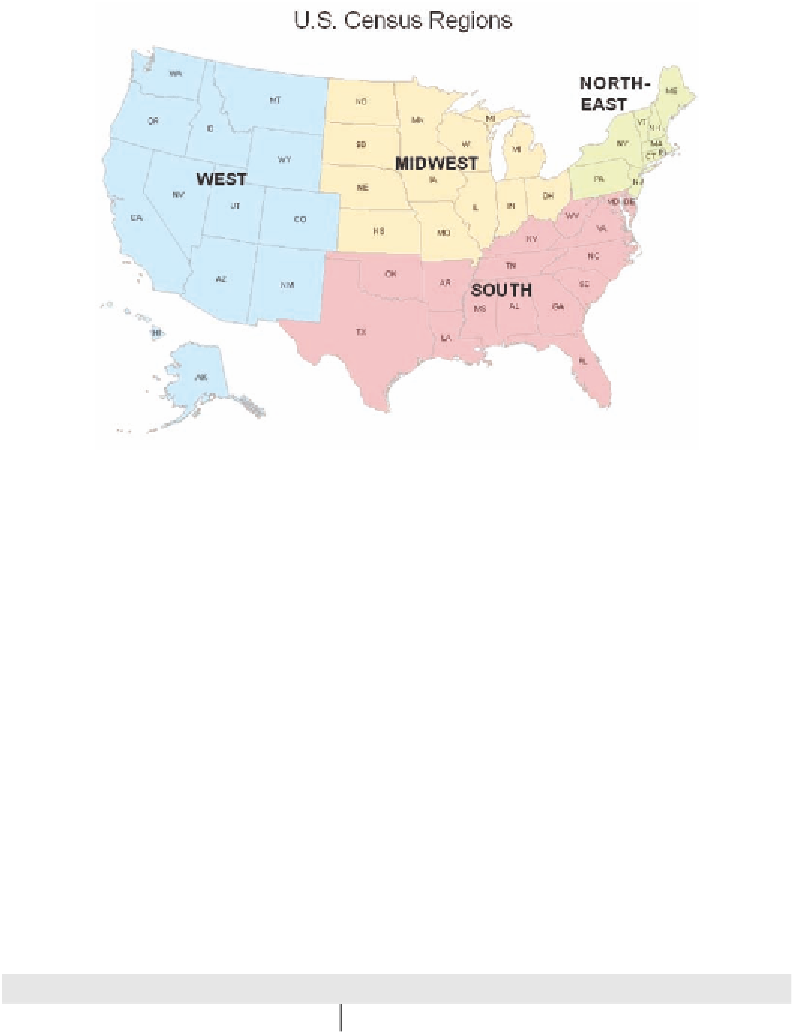
Figure 2. Source authors using Bureau of the Census information
For example, distance education programs, such
as on-line MBA programs, are often designed
for groups of specific individuals. Subsidies of
telecommunication rates, for another example,
are directed toward the household.
When it comes to the Internet if one member of
the household uses the Internet, the rest are likely
to use it too. The consequences can be seen by
comparing Table 3 and Table 4; the percentage of
at least one person going on-line in a household
is less than percentage of all individuals. The gap
between urban and rural households is wider than
for the gap between all urban and rural persons.
The gap between rural and urban households in
the Northeast, however, is still narrow.
Income differences have often been offered as
a key explanation for the disparity in Internet use
by individuals or households (Choudrie and
Dwivedi, 2006; Dwivedi and Irani, 2009; Flamm
and Chaudhuri, 2007; Stenberg and Morehart,
2007). The reason why can be seen in Figure 3.
Clearly low income households are less apt to
exploit the Internet than high income households.
Income, of course, is not the end of the story as
income is highly correlated to, or determined by,
education, age, and other factors, but household
Table 4. Households with at least one person going on-line at home or elsewhere, 2007
Metropolitan (percent)
Nonmetropolitan (percent)
Total (percent)
Northeast
71.0
69.5
70.9
Midwest
74.0
65.7**
72.1
South
70.7
58.3**
68.3
West
75.5
68.6**
74.9
Total
72.6
63.3**
71.1
Source: authors using CPS data.
Note: Difference between metro/nonmetro (** -- significant at 0.01).


Search WWH ::

Custom Search