Game Development Reference
In-Depth Information
Next, return to the Unity Editor and make sure that the script file
DebugTest.cs
,
as shown in code sample 2-9, is attached to an object in the scene and that the scene
includes other objects (any objects, such as cubes or cylinders). Then, run your game
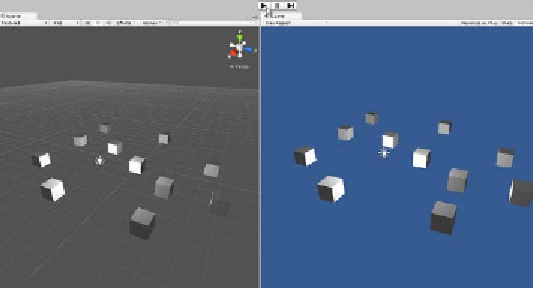
using the play button from the Unity toolbar, as shown here:
Running from the Unity Editor in preparation for debugging with MonoDevelop
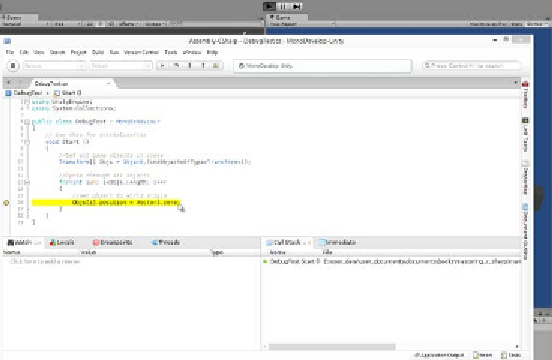
When you press the play button on the Unity toolbar with MonoDevelop attached,
the execution of Unity will freeze when the breakpoint is reached (the break
mode). The focus will switch to the MonoDevelop window with the breakpoint
line highlighted in yellow inside the source file that indicates the current step of
execution, as shown in the following screenshot. During this mode, you cannot use
the Unity Editor, and you cannot switch between viewports or even edit settings
inside the Object Inspector as you can with in-editor debugging. MonoDevelop is
waiting exclusively for your input to resume execution. The next few sections will
consider some useful debugging tools that you can use in the break mode.
Entering the break mode from within MonoDevelop