Game Development Reference
In-Depth Information
//-------------------------------------
//Function calls func3
void Func02()
{
Func03();
}
//-------------------------------------
//Function prints message
void Func03()
{
Debug.Log ("Entered Function 3");
}
//-------------------------------------
}
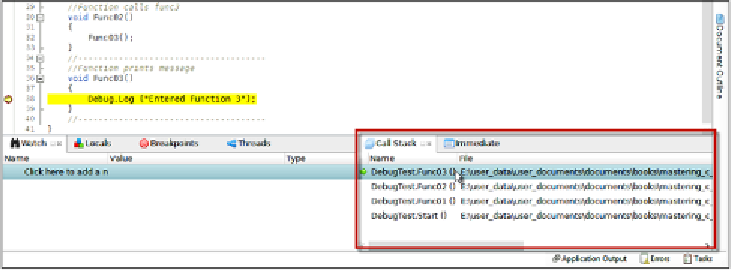
If a breakpoint is set in line 38 of code sample 2-10 (highlighted), execution will
pause when this line is reached. By reading this sample, we can see that one route
to that function is by the
Start
function calling
Func01
,
Func01
calling
Func02
, and
then
Func02
finally calling
Func03
. But how do we know that this is the only route?
It's technically possible, for example, for another class and function elsewhere in the
project to invoke
Func03
directly. So, how can we know the route by which we've
reached this function in this step while debugging? Based on the tools examined so
far, we can't. However, we can use the
Call Stack
window. This window, displayed
by default in the bottom-right corner of the MonoDevelop interface, lists all the
function calls that were made to reach the active function for the current step that
leads back to the first or initial function call. It gives us a breadcrumb trail of function
names that leads from the active function to the first or initial function. Thus,
Call
Stack
lists function names upside down, the active or most recent function being
at the top of the stack that leads downwards to the earliest or first function at the
bottom of the stack. You can also access the functions at their locations to assess
the variables in their scope, as shown here:
Using Call Stack to trace how a function was initiated during program execution