Graphics Reference
In-Depth Information
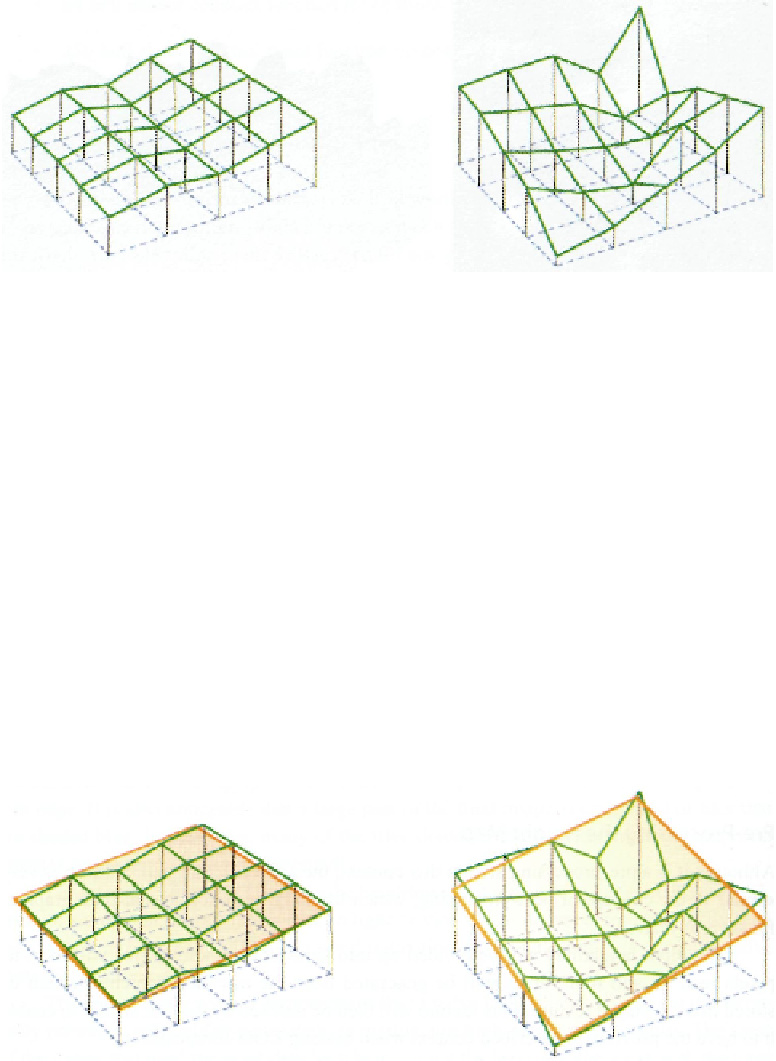
Figure 9.12.
Examples of coplanarity.
It is relatively straightforward to compute a variety of statistics from the source data,
but really, all that the hull shader cares about is having a measure of how much detail the
patch requires. Is this piece of terrain flat? If yes, generate less detail. Alternatively, is this
piece of terrain very bumpy and noisy? If yes, generate more detail.
A good objective for this pre-pass is to find a statistical measure
of
coplanarity
—to
what extent do the 256 samples lie on the same plane in 3D space?
This section covers a good solution to this question, one that maps cleanly to the GPU.
However, there is scope for potentially higher-quality results using Fourier or Harmonic
Analysis techniques familiar to mathematicians and physicists for deriving LOD metrics.
This is left as an exercise to the more adventurous reader!
Consider Figure 9.12. The left-hand side shows a relatively uniform slope, possibly
the side of a hill or valley. However, the right-hand side originates from a more complex
section of terrain and is consequently much more erratic and noisy. Ideally, the hull shader
would give the right-hand side a much higher level of detail, because, quite simply, that
Figure 9.13.
Planes fit over examples of different coplanarity.
Search WWH ::

Custom Search