Digital Signal Processing Reference
In-Depth Information
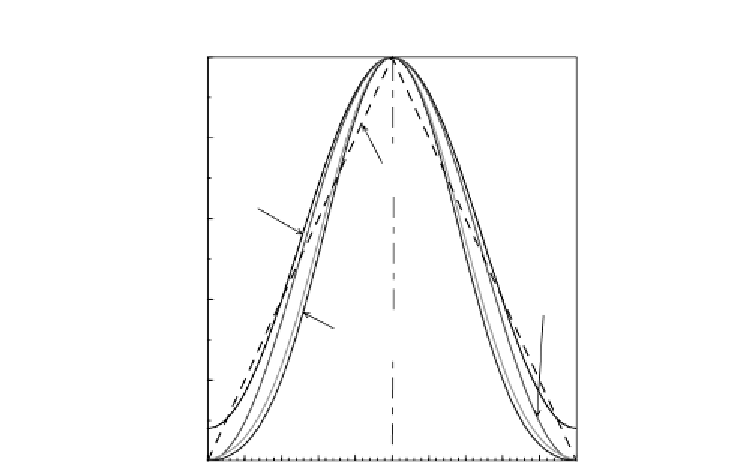
Rectangular
1.0
0.8
Bartlett
Hamming
0.6
0.4
Hanning
Kaiser
Blackman
0.2
n
0.0
0
N
−
1
(N
−
1)/2
Figure 4.2
Time plots of various window functions
where
I
0
is a zero order Bessel function given by,
2
k
∞
β
2
=
I
0
(β)
(4.8)
(k
!
)
2
k
=
0
The time and frequency domain shapes of these window functions are illus-
trated in Figures 4.2 and 4.3 respectively. As can be seen in Figure 4.3, the rect-
angular window has the highest frequency resolution, as it has the narrowest
main lobe, but the largest frequency leakage. On the other hand, the Black-
man window has the lowest resolution and the smallest frequency leakage.
The effect of these windows on the time-dependent Fourier representation of
speech can be illustrated by discussing the properties of two representative
windows, e.g. the rectangular window and the Hamming window.
The effects of using the Hamming and rectangular windows for speech
spectral analysis are shown in Figures 4.4, 4.5 and 4.6. In each figure, plots
(a) and (b) show the windowed signal
s(n)w(k
n)
and log magnitude of the
Fourier transform,
S
k
(ω)
, respectively, of the rectangular window. Similarly,
plots (c) and (d) show the windowed signal and log magnitude spectrum
of the Hamming window. In Figure 4.4, the results for a window duration
of 220 samples (27.5ms for 8 kHz sampling rate) for a section of voiced
speech is shown. When compared, the periodicity of the signal is clearly seen
−


Search WWH ::

Custom Search