Digital Signal Processing Reference
In-Depth Information
f
1
f
2
f
3
f
4
f
5
f
6
f
7
f
8
f
9
f
10
10
8
6
0
50
100
150
Frequency (Hz)
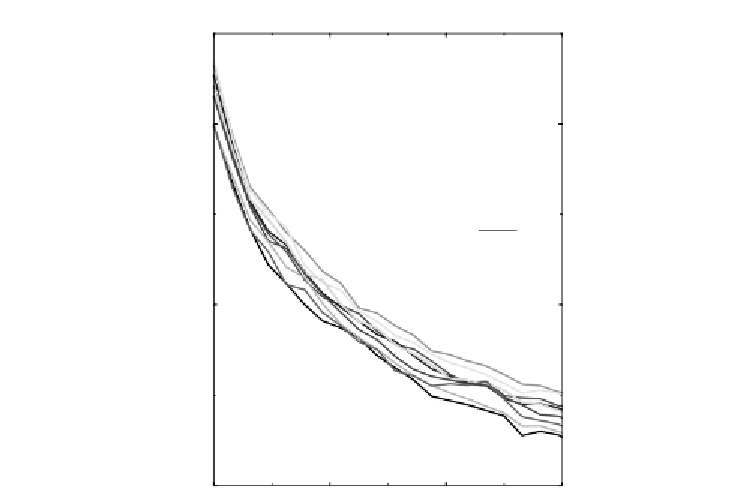
Figure 5.19
Low frequency region of the plots in Figure 5.18 expanded
•
The wide-sense stationary assumption of speech
In general, a signal
s(t)
is said to be wide-sense stationary (WSS) if the
expectation,
E
{
τ)
}
, is independent of time
t
and only dependent
on the time difference
τ
. In the window position test, the LSF tracks do not
contain high frequencies indicating that, for the synthetic speech file, the
WSS assumption is valid. In reality, speech is changing in characteristics
during the analysis frame. Therefore, the stationary assumption of our
speech segment within the analysis window is not strictly correct and
this is why high frequency variations are evident in the spectra of the
LSF tracks.
s(t)s(t
+
Table 5.13 shows the percentage of energies for three different bands com-
puted over four male and four female speakers each uttering eight seconds
from the NTT speech database. The band below 25Hz corresponds to a 20ms
LSF vector transmission rate whereas a band below 50Hz corresponds to a
10ms LSF vector transmission rate. Even thoughmore than 92% of the energy
is present in the band below 25Hz, the remaining 8% of the energy is enough
to produce higher LSF parameter variations in some specific speech sections
(Note that these figures are average over 32 seconds of speech and instanta-
neous variations are much larger.) Therefore, following from the discussion


Search WWH ::

Custom Search