Digital Signal Processing Reference
In-Depth Information
0.92
8.0e05
0.90
7.5e05
0.88
7.0e05
0.86
6.5e05
0.84
0.82
6.0e05
0.3 0.35
0.4 0.45
0.5 0.55
0.6 0.65
0.7
0.3 0.35
0.4 0.45
0.5 0.55
0.6 0.65
0.7
Prediction factor
Prediction factor
0.60
0.50
0.40
0.30
0.20
0.10
0.00
0.3 0.35
0.4 0.45
0.5 0.55
0.6 0.65
0.7
Prediction factor
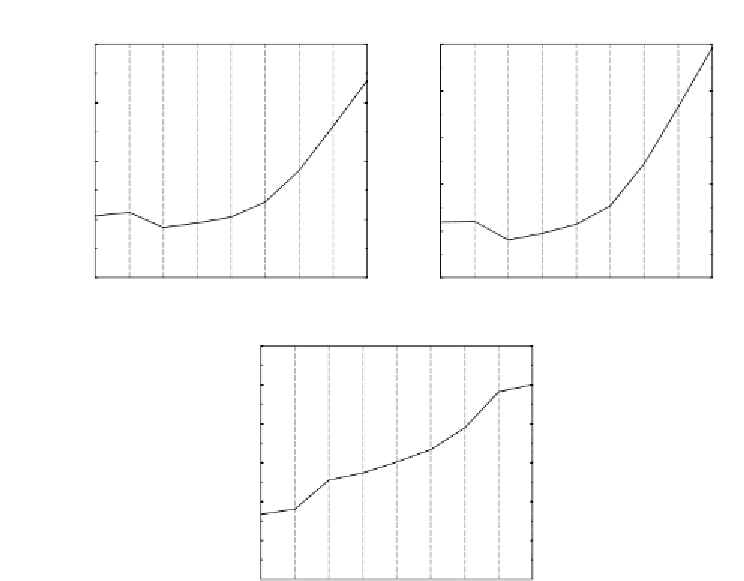
Figure 5.16
Performance of a MA-MSVQ Quantizer vs Prediction Factor
of
α
around 0.4, and not 0.65 as would be expected from Figure 5.15. WMSE
and average SD are lowest for 0.4, although outliers at 2 dB are slightly lower
at 0.3 than at 0.4. This is to be expected if the predictor does not work well,
at speech transitions for example. However this is not a problem as it is
possible to bias the training process towards producing fewer outliers with
only a small increase in the average SD. Moreover, the performance obtained
with 0.4 is significantly better than that of 0.65. This clearly shows that the
'intuitive' way of determining the prediction factor may not be correct.
5.9.4 PerformanceEvaluationofMAPrediction
In order to compare the performance of quantizers with and without MA
prediction, several codebooks have been trained with
α
0
.
4 for various
bit rates, using a 20ms update rate. In order to make comparisons with the
previous graphs easier, the quantizers all have 3-stage MSVQ codebooks. The
bit rates range from 20 to 26 bits, and the codebook structures are detailed
in Table 5.10. The search algorithm is a tree search with a depth of 32. The
overall performances are shown in Figure 5.17. The gain provided by the MA
=


Search WWH ::

Custom Search