Agriculture Reference
In-Depth Information
efficiency of the ground survey. Also, in contrast to a traditional soil map, the EM
map shows the pattern of soil variation at a high resolution (at a large scale), which
in itself can be very helpful in establishing the vineyard.
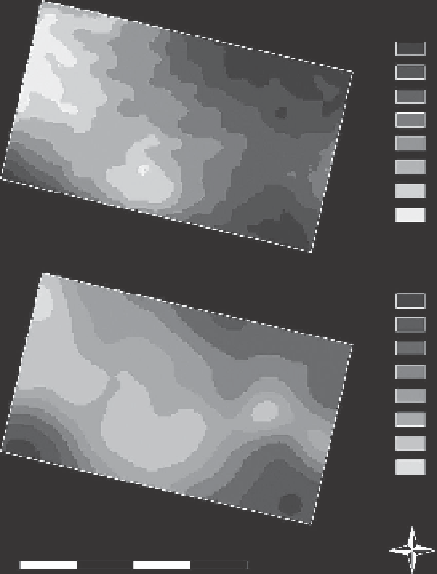
In some cases EM data can be correlated with the variation in a single
soil property, such as salinity or clay content, and a map of that property
produced. Figure 2.6 is an example of a vineyard map in which the variation
in the EM signal correlates well with changes in soil clay content. In general,
the accuracy of any EM-derived map of a particular soil property depends on
how well the EM signal can be calibrated against actual measurements of that
property in the field. The next section gives an example of calibration after an
EM survey.
Bulk electrical soil
conductivity (dS/m)
< 0.1
0.1 - 0.15
0.15 - 0.2
0.2 - 0.25
0.25 - 0.3
0.3 - 0.35
0.35 - 0.4
> 0.4
Profile clay index
< 6
6 - 8
8 - 10
10 - 12
12 - 14
14 - 16
16 - 18
> 18
N
0
50
100
150
200 Metres
W
E
S
Figure 2.6
(A) EM38 map of a small vineyard in the Murray-Darling
region, Victoria, Australia. (B) A map of soil profile clay index derived
from 130 sampling points in the same vineyard. The index is the
mean of the clay content (expressed as a percentage) at depths of 5 to
15 cm and 45 to 55 cm. (Courtesy of Dr. Robert Bramley, CSIRO
Ecosystem Sciences, Adelaide, South Australia.)