Geology Reference
In-Depth Information
Table 2.5
The NNR
MORVEL velocity model
Plate
œ
e
¥
e
¨
¨
1
¨
2
¨
3
AMU
63.4
237.5
0.298
0.001248
0.001962
0.004645
ANT
65.7
242.4
0.250
0.000829
0.001589
0.003976
ARB
48.8
351.7
0.561
0.006374
0.000933
0.007363
AUS
33.9
37.9
0.634
0.007241
0.005636
0.006170
CAR
35.6
267.6
0.286
0.000168
0.004062
0.002908
COC
27.0
235.7
1.197
0.010487
0.015371
0.009493
CAP
44.3
23.1
0.610
0.007008
0.002985
0.007445
EUR
49.3
253.8
0.223
0.000708
0.002435
0.002949
IND
50.4
356.9
0.545
0.006064
0.000333
0.007329
JDF
38.2
60.0
0.951
0.006529
0.011291
0.010270
LWA
51.9
291.0
0.286
0.001101
0.002876
0.003932
MAC
49.2
371.1
1.145
0.012831
0.002508
0.015120
NAM
4.6
279.7
0.208
0.000612
0.003564
0.000292
NUB
47.9
291.9
0.293
0.001277
0.003175
0.003788
NAZ
46.4
259.0
0.695
0.001597
0.008213
0.008791
PAC
63.5
114.4
0.650
0.002090
0.004605
0.010156
PHB
45.9
328.7
0.909
0.009435
0.005735
0.011401
RIV
20.3
252.7
4.535
0.022040
0.070903
0.027431
SAM
22.2
247.8
0.107
0.000656
0.001604
0.000707
SCO
23.0
254.5
0.146
0.000630
0.002263
0.000995
SOM
50.2
275.9
0.339
0.000391
0.003767
0.004551
SUR
32.3
249.2
0.106
0.000555
0.001459
0.000986
SUN
50.2
265.2
0.337
0.000313
0.003750
0.004522
SAN
29.9
323.2
1.361
0.016481
0.012351
0.011826
YTP
63.4
243.6
0.334
0.001163
0.002339
0.005218
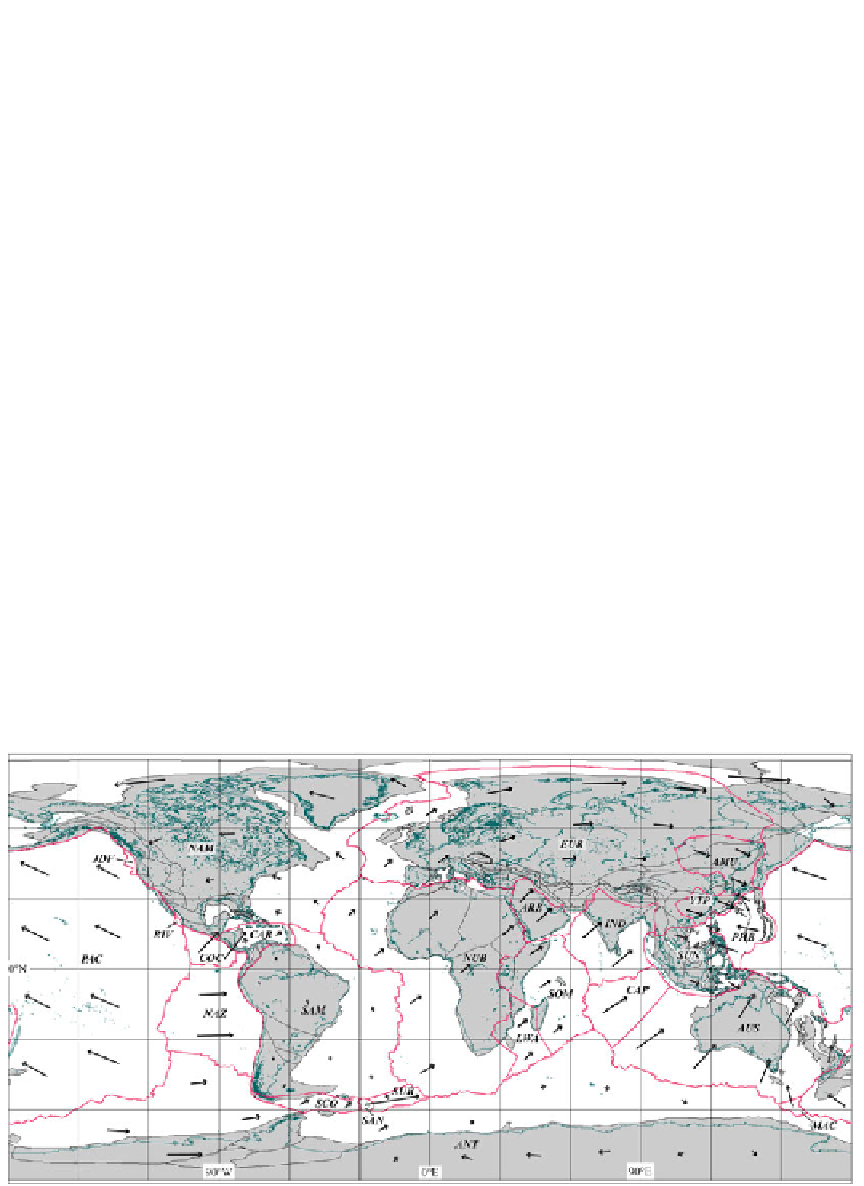
Fig. 2.39
The “absolute” plate velocity model NNR
MORVEL (DeMets et al.
2010
). The
length of the arrows
indicates 20 times the relative displacement of a plate with respect to an adjacent plate


