Geology Reference
In-Depth Information
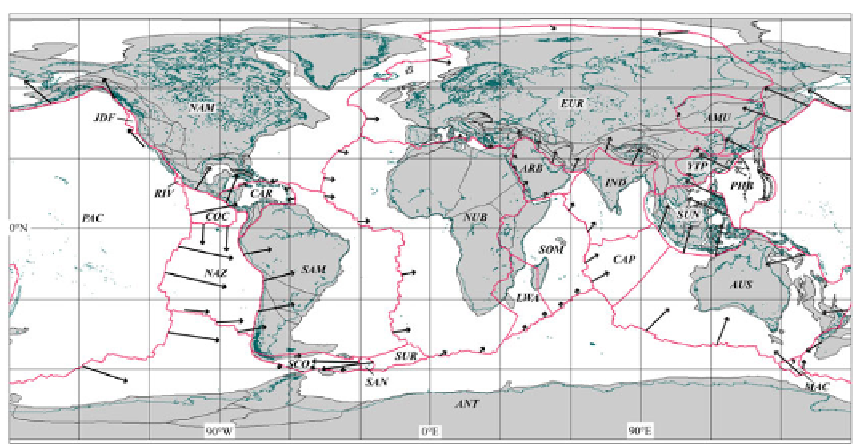
Fig. 2.38
The plate velocity model MORVEL (DeMets et al.
2010
). The
length of the arrows
indicates 20 times the
relative displacement of a plate with respect to an adjacent plate. Plate labels are listed in Table
2.3
Table 2.3
The MORVEL velocity model
Plate
Sym
œ
e
¥
e
¨
¨
x
¨
y
¨
z
Amurian
AMU
65.9
82.7
0.929
0.000841
0.006567
0.014801
Antarctica
ANT
65.9
78.5
0.887
0.001260
0.006194
0.014132
Arabia
ARB
60.0
33.2
1.159
0.008463
0.005538
0.017518
Australia
AUS
60.1
6.3
1.079
0.009331
0.001030
0.016325
Caribbean
CAR
55.8
77.5
0.905
0.001922
0.008668
0.013064
Cocos
COC
42.2
112.8
1.676
0.008397
0.019977
0.019649
Capricorn
CAP
62.3
10.1
1.139
0.009098
0.001621
0.017601
Eurasia
EUR
61.3
78.9
0.856
0.001381
0.007040
0.013105
India
IND
61.4
31.2
1.141
0.008154
0.004938
0.017484
Juan de Fuca
JDF
0.6
37.8
0.625
0.008619
0.006685
0.000114
Lwandle
LWA
60.0
66.9
0.932
0.003191
0.007481
0.014087
Macquarie
MAC
59.2
8.0
1.686
0.014921
0.002097
0.025276
North America
NAM
48.9
71.7
0.750
0.002702
0.008170
0.009864
Nubia
NUB
58.7
66.6
0.935
0.003367
0.007781
0.013944
Nazca
NAZ
55.9
87.8
1.311
0.000492
0.012819
0.018947
Philippine
PHB
4.6
41.9
0.890
0.011524
0.010340
0.001246
Rivera
RIV
25.7
104.8
4.966
0.019950
0.075508
0.037587
South America
SAM
56.0
77.0
0.653
0.001434
0.006210
0.009449
Scotia
SCO
57.8
78.0
0.755
0.001460
0.006868
0.011150
Somalia
SOM
59.3
73.5
0.980
0.002480
0.008373
0.014707
Sur
SUR
55.7
75.8
0.636
0.001534
0.006064
0.009170
Sundaland
SUN
59.8
78.0
0.973
0.001776
0.008356
0.014677
South Sandwich
SAN
3.8
42.4
1.444
0.018570
0.016957
0.001670
Yang Tze Platform
YTP
65.5
82.4
0.968
0.000927
0.006945
0.015374