Geology Reference
In-Depth Information
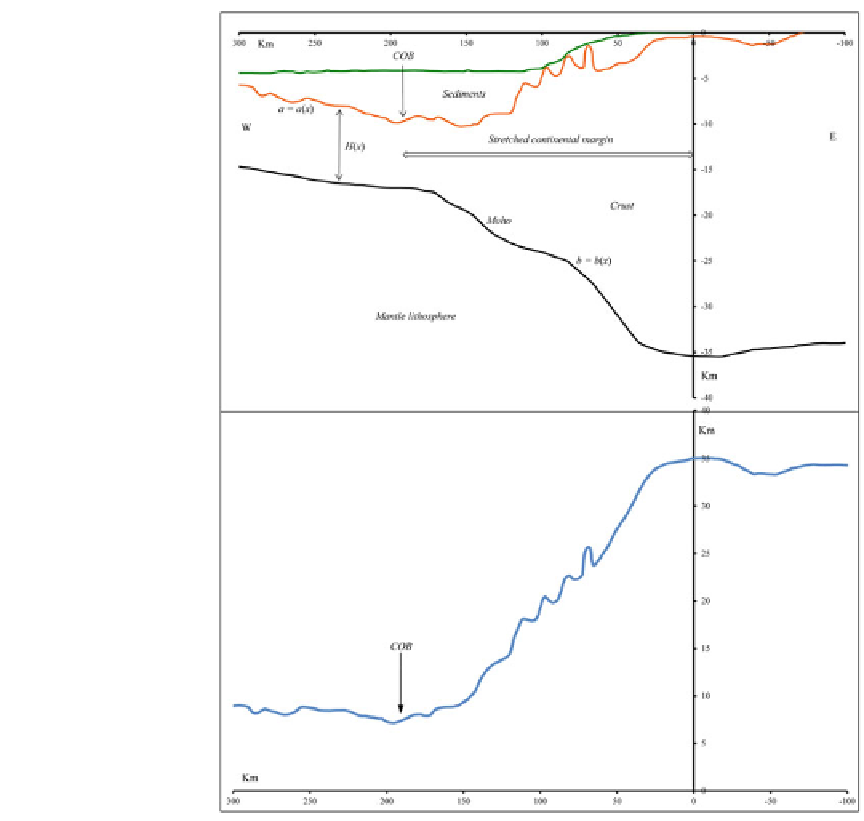
Fig. 2.22
Seismic
refraction profile SIS-04,
offshore Morocco
(Contrucci et al.
2004
),
projected onto the direction
of Triassic-Jurassic rifting
(
top
). The
green line
represents the bathymetric
surface. The
bottom panel
shows a plot of the crustal
thickness (excluding
sediments),
H
(
x
)
b
(
x
), along
the margin. The stretched
continental margin as
width
L
D
a
(
x
)
193 km. If we
restore the thickness to
H
0
D
Š
35 km, the width of
the margin is reduced to
L
0
110 km (pre-rift
width). Therefore, the
stretching factor “ is given
by: “ D
L
/
L
0
Š1.75
Š
say
a
D
a
(
x
)and
b
D
b
(
x
), of seaward increas-
ing offsets
x
along the profile. The example il-
lustrated in Fig.
2.22
shows the seismic pro-
file SIS-04, located offshore Morocco (Contrucci
et al.
2004
), after projection onto the direction
of Triassic-Jurassic rifting (Schettino and Turco
2009
). If
L
is the size of the stretched margin
(for example determined by the COB) and
H
0
is
the normal unstretched crustal thickness, then the
pre-rift restored size,
L
0
, and the stretching factor,
“, will be given by (Fig.
2.22
):
LH
0
“
D
L=L
0
D
(2.38)
Z
L
H.x/dx
0
As soon as the stretching factor “ has been
estimated, there are three possibilities for taking
into account thinning of passive margins during
the syn-rift stage in pre-rift reconstructions. In
a first method, the tectonic elements are defined
through their present day stretched boundaries,
but a pre-rift reconstruction will require an over-
lap of the stretched margins, as illustrated in
Fig.
2.23
. This method works well both in the
case of passive margins of oceans and for failed
Z
Z
L
L
1
H
0
1
H
0
L
0
D
Œa.x/
b.x/dx
H.x/dx
0
0
(2.37)