Geology Reference
In-Depth Information
100 mm year
1
(
red line
), and
v
0
D
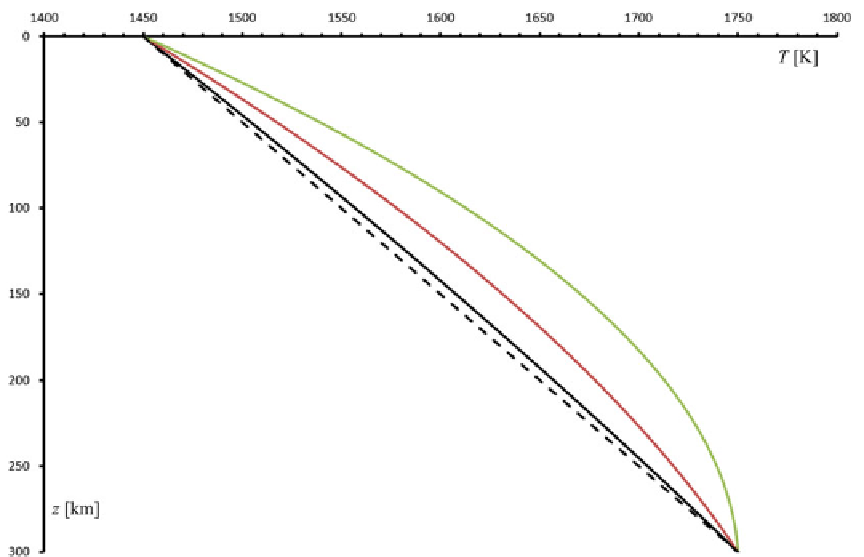
Fig. 13.5
Predicted temperatures in the asthenosphere in
the case of Couette flow. Here
z
is the depth starting
from the LAB and the curves refer to the case
v
0
D
v
0
D
150 (
green line
).
The other parameters are:
T
0
D
1,450 K,
T
a
D
1,750 K,
1kJkg
1
K
1
,
k
4Wm
1
K
1
, ¡
0
c
p
D
D
D
3,450 kg
50 mm year
1
m
3
, ǜ
10
20
(
dashed line
),
v
0
D
(
solid black line
),
D
Pa s, and
h
D
300 km
originate pressure-driven flows are associated
with a variety of sources of upper mantle
inhomogeneity. The first, obvious, possibility is
represented by thermo-chemical discontinuities
at the COBs or close to the cratonic roots.
This
edge
-
driven convection
is a form of small-
scale mantle convection that explains several
interesting geological phenomena (King and
Anderson
1998
and refs. therein), such as surface
topography anomalies, uplift of rift flanks, and
the anomalous igneous activity along some
important, source of upper mantle inhomogeneity
is represented by mantle plumes, which could
be responsible for large-scale flows in the
mantle and the acceleration of continents of
the dimensions of India (Cande and Stegman
2011
; Becker and Faccenna
2011
). It is likely
that in the next future we will be able to
improve our knowledge about these interesting
phenomena through a better comprehension of
the spatial distribution and kinematics of mantle
heterogeneity.
13.5
Stream Functions
and Two-Dimensional Flows
Let
v
D
v
(
r
,
t
) be the instantaneous velocity field
at a
fixed
time
t
and let
r
0
be an arbitrary space
point. Starting from
r
0
, we can build a parametric
curve
r
D
r
(—) such that:
d
d—
D
v
.r .—/;t/
(13.61)
A curve based on (
13.61
)isreferredtoasa
streamline
. Velocity vectors are always tangent to
these lines, which are commonly used to illustrate
the instantaneous pattern of velocity in a fluid