Geology Reference
In-Depth Information
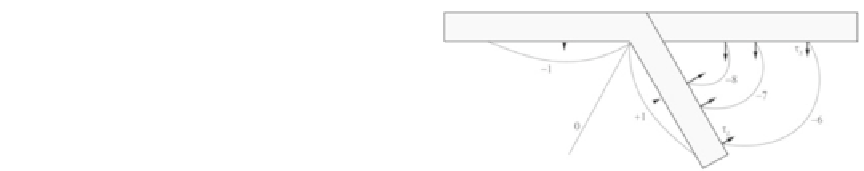
Now let us come to the resistive forces illus-
trated in Fig.
12.13
. There are essentially two
classes of forces that oppose plate motions. The
most important of them is represented by the
basal drag, £
D
, exerted by the asthenosphere,
which is always opposite to the vector of
rela-
tive
velocity of the lithosphere with respect to
the asthenosphere. In the next chapter, we shall
prove that the magnitude of this shear stress
increases linearly with relative velocity, astheno-
sphere viscosity, and horizontal pressure gradient
in the asthenosphere. It is generally agreed that
the basal drag is larger beneath the continents
(e.g., Forsyth and Uyeda
1975
), but some au-
thors argue that in the case of large continental
masses with deep roots this force could become
even dominant. For example, in his “continental
undertow” model Alvarez (
2010
) explains the
continued continental collision along the Alpine-
Himalayan belt by the active drag exerted by the
asthenosphere. The other class of resistive forces
is represented by frictional stress along strike-
slip or convergent plate boundaries. This class
also includes friction resistance associated with
slip of bending lithosphere beneath accretionary
wedges. The magnitude of these forces is small
(Forsyth and Uyeda
1975
), thereby they can be
generally ignored in numerical modelling.
A class of forces that was not considered by
Forsyth and Uyeda (
1975
) but has great impor-
tance in the total force balance is represented by
the normal forces on the upper and lower surfaces
of slabs due to dynamic pressure variations in
the surrounding mantle. In reality, Forsyth and
Uyeda (
1975
) included in their comparative anal-
ysis another force that is also related to dynamic
pressure variations in the asthenosphere. This is
the
suction
stress, £
S
, exerted on the overriding
plate (Figs.
12.13
and
12.14
) by the low-pressure
field existing beneath the accretionary wedge.
As pointed out by Tovish et al. (
1978
), the
action of a
hydrodynamic lift
£
L
on the subducting
lithosphere (Fig.
12.13
) is necessary to explain
why subduction angles are much smaller than
90
ı
, despite the gravitational torque exerted on
slabs tends to align them with the vertical. Just as
in the case of the ridge push, a quantitative study
of hydrodynamic lifting requires fluid dynamics
Fig. 12.14
Isobars and pressure distribution in a subduc-
tion zone (From Tovish et al.
1978
). The unit of pressure
is (
v
/(2ǜ
3
h
))
1/3
,where
v
is the velocity of convergence and
ǜ
3
is the non-linear viscosity of olivine
concepts that will be discussed in the next chap-
ter. For the moment, it is interesting to mention
the main result of the theoretical modelling per-
formed by Tovish et al. (
1978
), which is illus-
trated in Fig.
12.14
. The isobar field associated
with the
corner flows
in a subduction zone shows
low pressure in the oceanic corner, increasing
from small suction at the base of the unsubducted
plate to small compression along the lower part of
the slab. Conversely, the magnitude of the pres-
sure field is considerably higher in the arc corner
and determines strong suction of the upper plate
and slab lift, both increasing toward the corner.
Problems
1. Build a continental lithosphere geotherm us-
ing a layered crustal model, assuming 10 km
upper crust, 10 km middle crust, and 15 km
lower crust. Use reasonable values for the
radiogenic heat rates of each layer and for the
other parameters. In particular, use data from
Hofmeister (
1999
) for the thermal conductiv-
ity;
2. Determine
the
thickness
of
the
magnetic
crustal
layers
in
continental
and
oceanic
regions;
3. Determine the vertical slip rate along a frac-
ture zone;
4. Write a computer program that converts an
ocean floor age grid into a basement paleo-
depth grid for any assigned time
t
in the
geologic past. Any point having age
t
0
<
t
is removed from the output grid assigning a
NODATA_value
99999.0;