Geology Reference
In-Depth Information
lithosphere flattens and tends to a straight line.
At 100 km depth the predicted temperature in the
PCM is
210
ı
C higher. Regarding the surface
heat flow, the PCM flux curve shows a better fit
to the heat flow data at the extremes of the age
range. A detailed analysis of the PCM parameters
has shown that this model can account quite
satisfactorily for the observed heat flow (Stein
and Stein
1992
).
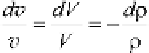
A direct consequence of the cooling of the
oceanic lithosphere is represented by the pro-
gressive increase of its density. Let ¡
D
¡(
z
,
t
)
be the rock density at depth
z
and time
t
.This
quantity is an intensive state variable that varies
with temperature
T
and pressure
P
. In the case
of decreasing temperature, density increases be-
cause the volume of a rock body decreases by
thermal contraction.
In general, the thermodynamic relation that
determines the change of volume associated with
variations of temperature and pressure is:
and to variations of volume by the following
simple equation:
(12.56)
Therefore, (
12.55
) can be rewritten in terms of
density as follows:
d¡
D
¡.“dP
'dT/
(12.57)
When the rock body can change freely its
volume after a temperature variation, the pressure
P
is invariant, so that (
12.57
) assumes the form:
d¡
¡
D
'dT
(12.58)
Conversely, when the rock is confined, so
that its volume does not change (
dv
D
0), the
variations of temperature and pressure are related
by the following equation:
@V
@P
@V
@T
“dP
'dT
D
0
(12.59)
dV
D
dP
C
dT (12.53)
In the oceanic lithosphere, Parsons and Sclater
(
1977
) estimated that the thermal expansion coef-
ficient ' assumed the value '
D
3.28
10
-5
K
-1
,
while the more recent best-fitting value obtained
by Stein and Stein (
1992
)is'
D
3.1
10
-5
K
-1
.
We can use this estimate and the HSC model
isotherms of Fig.
12.9
to calculate the horizontal
gradient of density in the oceanic lithosphere. For
example, Fig.
12.9
shows that at 70 km depth the
distance between the 1,000 and 800
ı
Cisotherms
is
t
D
48 Myrs. Therefore, assuming a spread-
ing rate
v
D
30 mm/year, we obtain a horizontal
distance
x
D
½
v
t
D
720 km between the two
isotherms. This implies a horizontal gradient of
temperature @
T
/@
x
Š
0.28
ı
C/km at 70 km depth.
Consequently, using (
12.58
) and assuming that '
does not change significantly with temperature,
we can easily integrate (
12.58
) obtaining a total
variation of density of
21 kg/m
3
in 720 km.
Regarding the isothermal compressibility, it in-
creases with temperature and assumes values be-
tween “
D
0.80
10
-12
T
p
The derivatives in this expression are prop-
erties of the material that are usually expressed
through the coefficient of thermal expansion, ',
compressibility
“, given by:
@V
@P
1
V
“
D
(12.54)
T
Substituting (
12.3
)and(
12.54
)into(
12.53
)
gives the following expression for
dV
:
dV
D
V.
“dP
C
'dT/
(12.55)
This expression determines the variation of the
extensive variable
V
associated with changes of
P
and
T
. It is usually convenient to express vol-
ume variations in terms of an intensive variable
rather than an extensive one. To this purpose,
we introduce the
specific volume v
1/¡,which
represents the volume per unit mass. The relative
variations of
v
are linked to variations of density
Pa
-1
(at
T
700 K) and
“
D
1.20
10
-12
Pa
-1
at
T
2, 750 K (Arafin
et al.
2008
).