Geology Reference
In-Depth Information
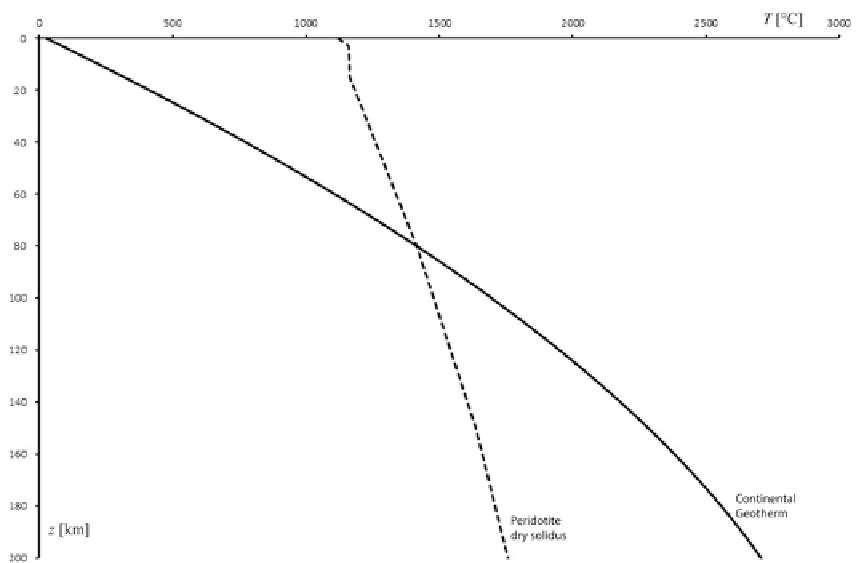
Fig. 12.3
Continental geotherm (
solid line
) for constant rate of heat production
H
.The
dashed line
shows the dry
where
H
0
is the radiogenic heat production rate
per unit mass at the Earth's surface and
h
is a
length scale parameter for the decrease of
H
with
depth. In this instance, (
12.18
) assumes the form:
This result, which has been confirmed by
direct observations, shows that the surface heat
flow depends linearly from the radiogenic heat
production rate at the Earth's surface. The length
scale parameter
h
and the basal flux
q
m
can
be estimated fitting a linear regression curve
through pairs of observed values of
q
0
and
H
0
.
It results that
h
Š
10 km and
q
m
28 mWm
2
(Turcotte and Schubert
2002
). Further integration
of (
12.20
)gives:
k
d
2
T
d
z
2
C
¡H
0
e
z
=h
D
0
(12.21)
To solve this equation, we assume that at great
depth, at the lower boundary of the radiogenic
heat production layer (e.g., at the Moho), we have
an upward flux
q
D
-
q
m
(note that for
dT
/
dz
>0,
T
increases downwards in the positive
z
direction,
so that heat flows in the
negative
z direction).
Such a basal flow can be approximated through
the boundary condition:
q
(
z
)
!
-
q
m
as
z
!1
.
A first integration of (
12.21
)gives:
¡H
0
h
2
k
1
e
z
=h
(12.24)
q
m
k
z
C
T.
z
/
D
T
0
C
A possible distribution of temperature in the
continental crust, based on (
12.24
), is shown in
Fig.
12.4
. We note a substantial difference with
respect to the trend illustrated in Fig.
12.3
,which
shows a more linear growth in the crust.
This improved geotherm predicts a temper-
ature of
500
ı
C at 40 km depth, which is
much less than the
770
ı
C of the previous
model. However, a downward continuation of
q.
z
/
D
¡H
0
he
z
=h
q
m
(12.22)
Therefore, the surface heat flux will be given
by:
q
0
D
q.0/
D
¡H
0
h
C
q
m
(12.23)