Geology Reference
In-Depth Information
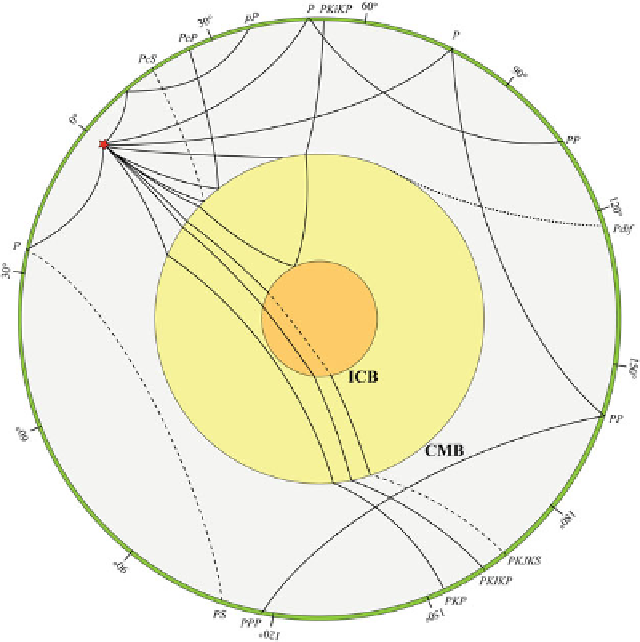
Fig. 9.24
Main mantle
and whole Earth ray paths
from a deep earthquake
(
red star
) and phase names.
P
and
S
waves are shown
respectively as
solid
and
dashed lines
. Diffractions
are indicated as
dotted
lines
. The different colors
indicate inner core
(
orange
), outer core
(
yellow
), mantle (
grey
), and
lithosphere (
green
).
Nomenclature for phases
starting as
S
waves is
similar
sS
,
sP
,etc.(Fig.
9.24
). The identification of
phases on teleseismic seismograms requires some
additional caution. First, it is often necessary to
apply band-pass or low-pass filtering (with high
cut-off frequency between 0.07 and 0.1 Hz) to
allow a correct picking of the
S
phase arrival
through detection of the change of frequency that
is usually associated with
S
waves. Furthermore,
at teleseismic distance the first arrival is a
P
wave only for <110
ı
. In the shadow zone
determined by the drop of velocity in the external
core, which is the range 110
ı
<<145
ı
,the
earliest arrival is a diffraction of
P
along the
CMB, which is termed
Pdif
(Fig.
9.24
). Beyond
this range, for >145
ı
, the first arrival is
PKP
.
Figure
9.25
shows a teleseismic record for the
same event of Fig.
9.19
.
Picking of seismic phases at a number of
stations for several tens of years has allowed
the construction of detailed travel time curves
since the 1940s and has furnished the basis for
building a reliable picture of the Earth's internal
structure (e.g., the PREM model, Dziewonski and
Anderson
1981
). The first travel time tables were
published by Jeffreys and Bullen (
1940
), when
modern computers had not yet been invented. It
is striking that the much more recent IASP91
model (Kennett and Engdahl
1991
) presents only
small differences with respect to the original JB
tables. The most recent compilation of empirical
travel times is an improvement of IASP91, which
has been used to build the radial velocity model
named AK135 (Kennett et al.
1995
). Figure
9.26
shows travel time curves for the major phases,
relative to an earthquake with focus at the Earth's
surface.
Although these curves can be used to predict
the approximate arrival times on a seismogram, it
is important to note that lateral inhomogeneities
along the raypaths, as well as local departures of
the seismic velocities from the global averages,
will determine a shift of the observed arrival time
with respect to the theoretical value. In the future,
it is likely that only minor adjustments will be