Geology Reference
In-Depth Information
d
2
dp
2
D
dX
dp
(9.73)
Therefore, the curve £
D
£(
p
) is concave
upward in the case of prograde segments and
concave downward in the case of retrograde
branches. Differently from the curve
T
D
T
(
X
),
this curve is
always
a single-value function,
thereby it can be used more easily to determine
velocity models from travel time data.
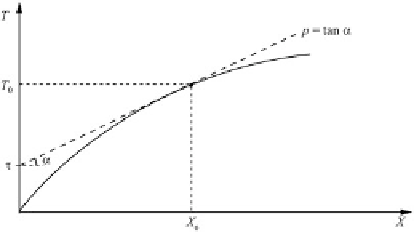
Fig. 9.15
A point (
X
0
,
Y
0
) on the travel time curve can be
uniquelly identified by an intercept £ and the slope
p
of
the tangent to the curve at the point
9.6
Low-Velocity Zones
solutions (
9.53
)and(
9.55
)into(
9.69
) to obtain
an expression for the delay time £:
Low
-
velocity zones
(
LVZ
) are regions where the
seismic velocity decreases with depth, in contrast
to a general trend characterized by positive gradi-
ents (hence by increasing velocities). According
to Snell's law, we have that seismic rays are
bent downwards within an LVZ, as illustrated in
Fig.
9.16
. Clearly, no seismic ray can bottom in
an LVZ, and those that penetrate one of these
regions will turn at greater depth, where the
velocity
c
has raised above any velocity in the
LVZ. Note that the seismic ray emerging at point
C
in Fig.
9.16
has the same parameter of the ray
emerging at
A
. In fact, the ray with turning point
at the upper boundary of the LVZ will bifurcate
at its bottom, generating an additional ray that
travels through the LVZ. Seismic rays with a
slightly less parameter will have a
decreasing
range, back to a caustic point at the far end of
the
shadow zone
.
In presence of an LVZ, the travel-time curve,
T
D
T
(
x
), and the delay time curve, £
D
£(
p
),
show a gap respectively for a range of distances
corresponding to the shadow zone at the Earth's
surface and for a range of values of the ray
parameter
p
(Fig.
9.17
). At global scale, the most
important example of LVZ is a region of astheno-
sphere or lower lithosphere between 100
˙
20 km
and
220 km depth, which is characterized by an
average 1.08 % drop in ' and 1.13 % drop in “
in the PREM model (Dziewonski and Anderson
This upper mantle LVZ has greater thickness
and velocity reduction beneath the oceans, and
the velocity drop can reach 5 % in some regions
"
#
d
z
Z
z
max
s
2
.
z
/
p
s
2
.
z
/
p
2
p
2
p
s
2
.
z
/
p
2
.p/
D
2
0
Z
Z
z
max
z
max
p
s
2
.
z
/
p
2
d
z
D
2
D
2
s
z
.
z
/d
z
0
0
(9.70)
where we have used the expression (
9.50
)forthe
vertical slowness. In the case of a material formed
by a stack of homogeneous layers, this expression
assumes the form:
£.p/
D
2
X
i
q
s
i
p
2
z
i
D
2
X
i
ǜ
i
z
i
I
s
i
>p
(9.71)
The slope of the curve £
D
£(
p
) is given by:
Z
z
max
p
s
2
.
z
/
p
2
d
z
d£
dp
D
2
d
dp
0
Z
z
max
1
p
s
2
.
z
/
p
2
d
z
D
X.p/
(9.72)
D
2p
0
Therefore,
X
(
p
)
0 implies
d
£/
dp
< 0, and the
curve £
D
£(
p
) is monotonically decreasing also
in the case of triplications. Now let us take the
second derivative of (
9.70
). We have: