Geology Reference
In-Depth Information
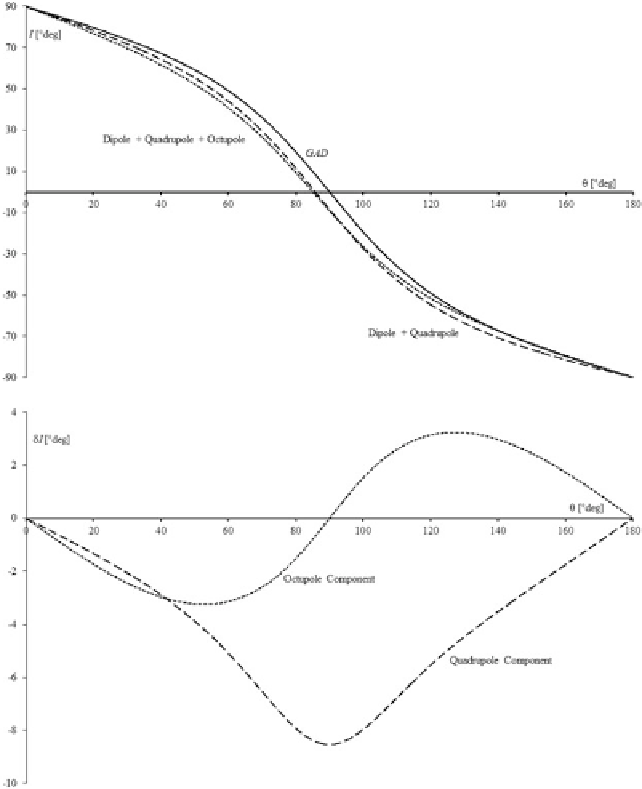
Fig. 6.42
Predicted
inclination as a function of
colatitude for three
paleomagnetic field
geometries: GAD (
solid
line
),adipolefieldplusa
quadrupole component
(
dashed line
), and a field
which includes all zonal
components up to degree
two (
dotted line
). In this
example,
G
2
D
0.10 and
G
3
D
0.05
Fig. 6.43
Predicted
inclination anomaly as a
function of colatitude for a
quadrupole component
(
dashed line
)andan
octupole component
(
dotted line
). In this
example,
G
2
D
0.10 and
G
3
D
0.05
der Voo
1993
), which introduced a discrepancy
between Permian-early Triassic paleopoles from
Gondwana and those obtained from Laurasian
sites.
In this instance, Permian and early Triassic re-
constructions did not bring the two data sets suf-
ficiently close to the North Pole, because Gond-
wana was placed too northwards with respect to
Laurasia in the fit of Pangaea. The attempt to keep
the GAD hypothesis led to several alternative,
more or less creative, fits of this supercontinent,
which are referred to as Pangaea
A
2,
B
,or
C
fits.
Apparently, the only alternative solution to the
paleomagnetic discrepancy, which would have
allowed to retain the classic
A
1 fits (e.g., that il-
of significant high-degree zonal components in
the paleomagnetic fields. However, more recent
studies have questioned this interpretation, which
does not take into account of a phenomenon
known as
sedimentary inclination error
.King
(
1955
) first observed that the inclination of rem-
nant magnetization of artificial sedimentary spec-
imens,
I
, was different from that of the magnetiz-
ing field,
I
F
. He called this difference
inclination
error
:
•I
D
I
F
I
(6.72)
The experiments of King (
1955
) showed that
•
I
is independent from the field strength, but
depends from the fraction
f
of particles with