Geology Reference
In-Depth Information
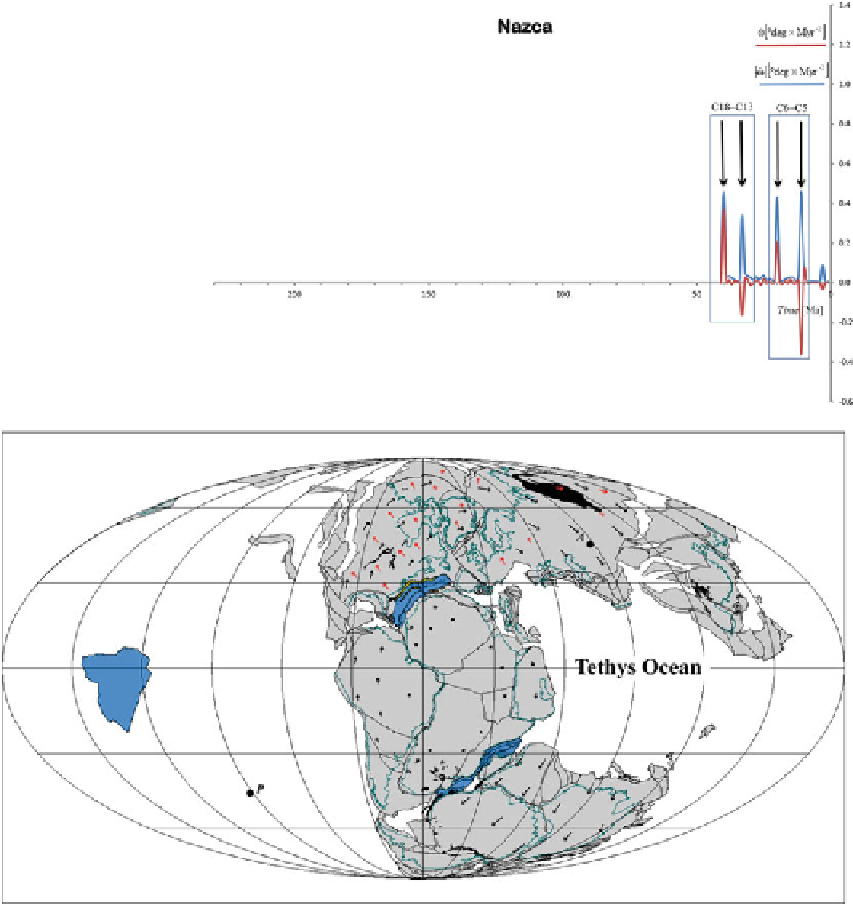
Fig. 6.32
Magnitude of
the angular acceleration
vector (
blue line
)and
variations of angular
velocity (
red line
)for
Nazca since the late
Triassic (230 Ma).
Boxes
indicate possible events of
traction
Fig. 6.33
Reconstruction at 154 Ma (M25 - Kimmerid-
gian), illustrating the acceleration field of Laurasia (
red
arrows
) and the global plate velocities (
black arrows
).
A
and
P
are respectively the antipole and the pole of
acceleration.
Black
areas are LIPS. Coastlines are overlaid
for reference
C34 and C21. Cande and Stegman (
2011
)have
suggested that the northward acceleration of
India during the Cretaceous to Eocene time
interval was determined by the push exerted
by the Reunion plume head. Conversely, no
clear connection exists between the traction of
N. America - Eurasia and plume magmatism.
Figure
6.35
shows a reconstruction at 84 Ma
(M10 - Santonian), where we can observe a
possible episode of TPW, associated with a
counterclockwise rotation of the lithosphere
about an Equatorial pole. A remarkable feature
of this reconstruction is the considerable
linear
acceleration of N. America and Eurasia, despite
their modest increase of
angular
velocity. This
depends from the location of the acceleration
poles or antipoles, which are both far from these
plates. This is an important point:
the location