Geology Reference
In-Depth Information
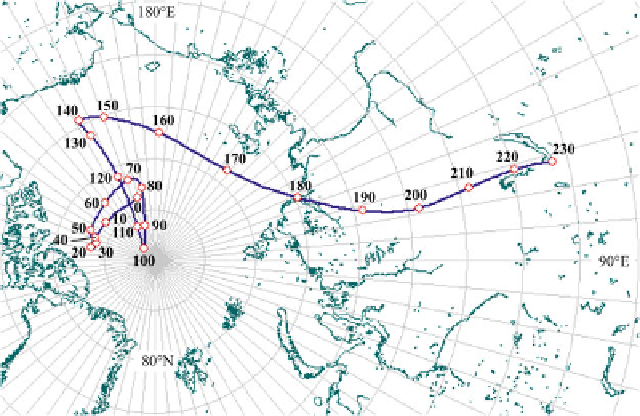
Fig. 6.14
Spherical spline
APW path for N. America.
This best-fitting curve has
been generated using the
algorithm of Jupp and
Kent (
1987
)anda
smoothing parameter
“
50. North American
paleopoles have been
selected from the GPMDB
using the
minimum-reliability
criteria of Schettino and
Scotese (
2005
), but no
further filtering has been
applied. Confidence limits
are not displayed for clarity
D
maximum number of continuity constraints. The
segmented nature of these functions gives them
more flexibility than polynomials and allows a
better adaption to the local characteristics of the
data. The parameters “ and
m
can be chosen
manually, according to some known properties
of the estimator, or computed by algorithms that
take into account of the actual data and some
optimality criteria. When the only assumption
about is that this function is continuously
differentiable and has a square integrable second
derivative, then
m
D
2, and the resulting estimator
is a cubic smoothing spline.
The independent statistical analysis of paleo-
latitude and declination time series represented a
major point of controversy, to such an extent that
the a famous geophysical journal rejected to pub-
lish the paper submitted by the proponents of this
method. The criticizers of the approach followed
by Schettino and Scotese (
2005
) questioned the
fact that
independent
regressions of declination
and paleolatitude data were statistically incor-
rect (e.g., Ruiz-Martínez et al.
2012
), because
declination and inclination (hence paleolatitude)
are
not
independent variables. To understand this
point, let us assume that a time series of unit
vectors
u
i
D
u
(
t
i
) is converted into a sequence
of site-dependent paleolatitude and declination
pairs (œ
i
D
œ(
t
i
),
D
i
D
D
(
t
i
)). If we perform inde-
pendent statistical regressions of these two time
series and then convert back the smoothed pairs
(œ
0
(
t
),
D
0
(
t
)) into unit vectors
u
0
(
t
), then these
vectors will
not
form, in general, a best fitting
spherical regression curve of the original time se-
ries. In this instance, we say that œ and
D
are not
independent each other from the statistical point
of view. In fact, while œ
0
(
t
)and
D
0
(
t
)) will satisfy
at best the maximum likelihood principle for the
corresponding curves of paleolatitude and decli-
nation, their combination in the spherical variable
u
0
(
t
) will not necessarily fit at best the unit vectors
u
i
in the least-squares sense. Conversely, unit
vectors sampled along a real best fitting curve
on the sphere (e.g., a spherical spline) will not
generally produce paleolatitude and declination
pairs that fit at best the corresponding time series.
For example, Fig.
6.14
shows a spherical smooth-
ing spline APW path for the North American
craton, generated using the algorithm of Jupp and
Kent (
1987
) and without paleopole transfer from
other continents. We may use this APW path to
get smoothed curves of paleolatitude and decli-
nation for a reference point in North America.
However, Fig.
6.15
shows that these functions
would
not
coincide with best fitting smoothed
curves of paleolatitude and declination, which
can be built using the same data set and a similar
degree of smoothing. In general, the curves of
predicted paleolatitude and declination generated
from smoothed APW paths will not represent best