Geology Reference
In-Depth Information
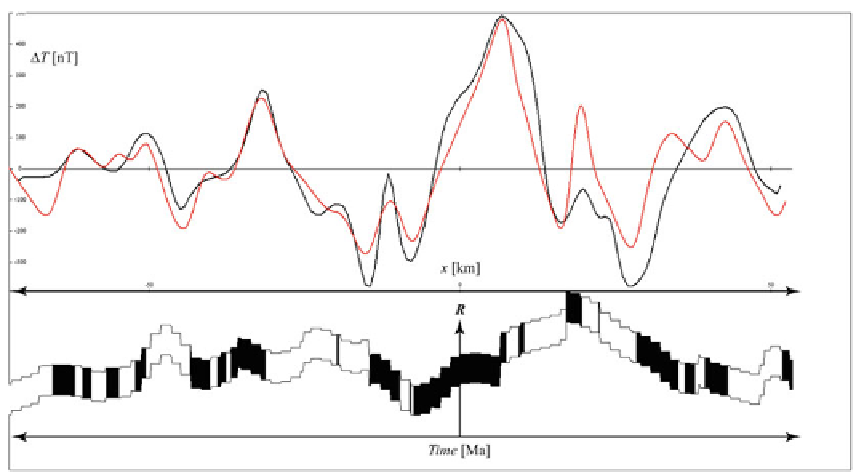
Fig. 4.10
An example of sea floor magnetization and
magnetic anomaly signal in the central Atlantic. The
black
and
red lines
show respectively the measured and model
anomalies, while the
lower panel
shows the resulting
predicted magnetization of the oceanic crust, with the
pattern of normal (
black
) and reversed (
white
)blocks.
R
is the ridge
referred to as
anomalies
and are numbered pro-
gressively according to a nomenclature that will
be described later. Assuming that the spreading
velocity
v
was constant, Heirtzler and colleagues
could have converted promptly the anomalies
x
i
into ages of the top of each chron,
T
i
, obtaining
a geomagnetic polarity time scale. In fact, the
scaling formula is simply:
Atlantic and North Pacific anomalies showed
a linear correlation between the two data sets.
Consequently, the South Pacific was eliminated
as a standard for the construction of a time
scale. Finally, they selected the South Atlantic
profile as a standard, because of its length
and better anomaly pattern. The assumed
constant velocity was 19 mm year
1
for the
last 80 Myrs. Testing the predicted ages of the
corresponding anomalies was a major objective
of the Deep Sea Drilling Project (DSDP) from
the late 1960s to the early 1980s. Further
biostratigraphic calibration points were provided
by magnetostratigraphic investigations of marine
sedimentary sequences. The most important of
these studies was undoubtedly that performed
on the Late Mesozoic and Cenozoic pelagic
limestone sequences in the Umbria-Marche
Apennine, Italy (Lowrie and Alvarez
1977
). The
new data allowed the construction of more refined
geomagnetic polarity time scales, notably the
Mesozoic time scale of Gradstein et al. (
1994
),
the Late Cretaceous - Cenozoic time scale of
Cande and Kent (
1995
), and the more recent
Phanerozoic time scale of Gradstein et al. (
2004
).
2x
i
v
T
i
D
(4.51)
However, there was no warranty that the
spreading rate had remained constant for any
of the magnetic profiles. Heirtzler and colleagues
had some
calibration points
, consisting into sea
floor locations with known age. For example,
they knew that the magnetic basement at anomaly
six in the North Pacific and South Atlantic
had an age of 20-22 Ma. Therefore, these
authors performed a comparative analysis of
the magnetic profiles, concluding that the South
Pacific spreading rate had varied with time,
whereas the South Atlantic and North Pacific
velocities might be considered approximately
constant. In particular, an
x
i
-
x
i
plot of South