Image Processing Reference
In-Depth Information
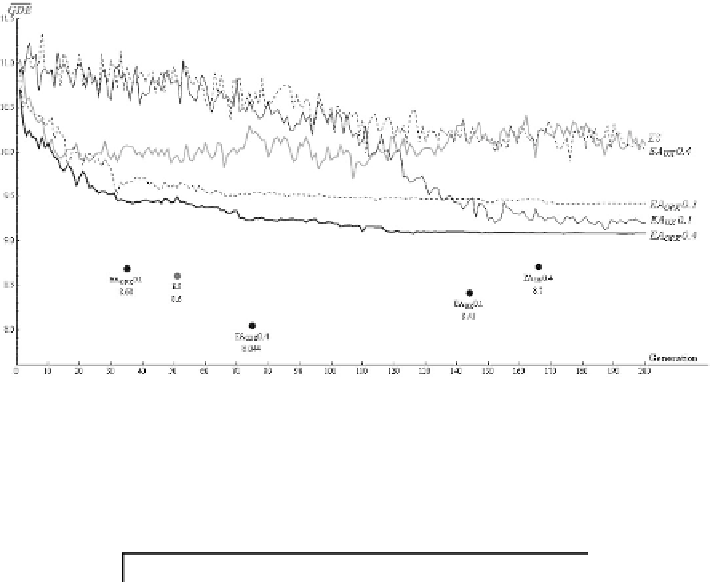
Fig. 11.21
The comparison of the means of the means of GDEs in a population of 50 for
each generation in 10 trials for five evolutionary methods. The best solution for each method
is indicated by a dot.
EA
OPX
with mutation intensity 0.4 produced consistently the best
solutions.
Table 11.4
The results of the experiments for the 100
×
100 shading array
ES
EA
UX
EA
OPX
m
i
1
0.1
0.4
0.1
0.4
GDE
min
8.6
8.41
8.7
8.68
8.04
GDE
max
9.39
9.44
9.41
9.58
9.71
GDE
min
9
8.9
9.1
9.1
9
σ
T
0.3
0.3
0.2
0.3
0.6
strategy, for example if only one trial is to be performed, ES should be chosen, since
the worst result in all ES trials is better than in other methods.
EA
UX
with mutation
rate
m
r
= 0.4 is the most predictable, in a sense that the best results in each trial
are close and the mean value is competitive. However,
EA
UX
with
m
r
= 0.1 returns
the best results on average, while
EA
OPX
with
m
r
= 0.4 gives the best overall result.
Higher mutation rate (0.4) results in more scattered results, which, however, have
the potential of reaching exceptionally good values. Therefore if a larger number of
trials can be afforded, the latter method is recommended.
11.6
Prototypes
Although the research on CA commenced already over half a century ago, the physi-
cal devices based on them are still very scarce. The completion of the first hardware


Search WWH ::

Custom Search