Image Processing Reference
In-Depth Information
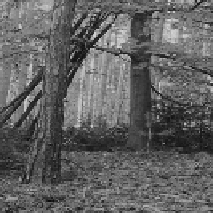
Original Images
Output Images
Fig. 7.7
Scenario 2: input and output images
7.4.4
PSNR
Measuring the PSNR (peak signal-to-noise ratio) of our proposed method is the next
experiment. It indicates the maximum possible power of a signal and the power of
corrupting noise that affects the output. We mentioned that all pixels in both of the
input and output images in our proposed method are based on 8 bits. The result
of PSNR for our proposed algorithm is shown in Table 7.7. Typical values for the
PSNR in lossy image and video compression are between 30 and 50 dB, where
higher is better [3], therefore, our proposed algorithm has a good PSNR.
This experiment indicates that scenario 1 produces a very little better PSNR than
scenario 2. This kind of experiment in the dataset indicates that using logical opera-
tion instead of arithmetic operation was not generating quite different result regard-
ing the PSNR.
7.4.5
Secret Key Sensitivity
An ideal digital image encryption system should be sensitive with respect to the
secret key. A little change of a single byte in the secret key should generate a com-
pletely different encrypted image and vice versa. Table 7.8 shows the rate of secret
key sensitivity. Previous experiments indicate that scenario 2 is better than scenario
1 in average, so in this experiment we just focus on scenario 2. 'Sara' is an image
which is shown at the first row of Figure 7.7 and 'Forest' is the second one. Since
one of the our goal is to develop sensitive cipher key for image forger detection


Search WWH ::

Custom Search