Geoscience Reference
In-Depth Information
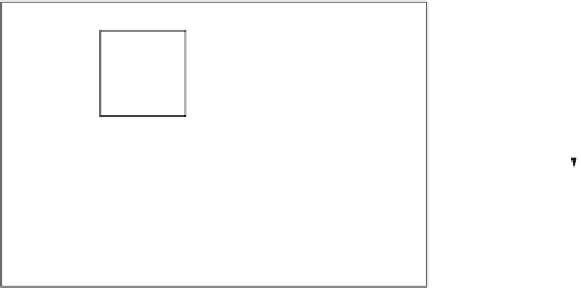
Interrogation area
Divide each recorded
image into a grid of points
P (i,j )
1
z
1w
Set an I.A. at P on the first
image
t
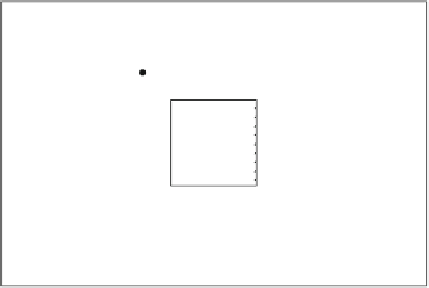
Research area
- Choose another I.A. at P
2
on the second image;
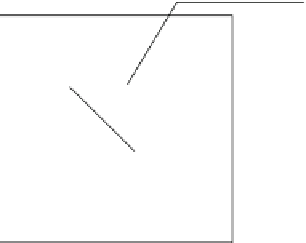
- Calculate cross-correlation
coefficient C;
- Find t
he
maxim
um
C;
- Find PP
2
max
and U=PP
2
max
/
Δ
t
at P;
- Repeat sequence for all the
grid points.
P
(i,j )
r
P
2
(i+x,j+y)
r
t +
Δ
t
Fig. 5 General cross-correlation algorithm for PIV image processing
I
1
(
i
,
j
)and
I
2
(
i
,
j
) being the pixel values in images 1 and 2;
s
2
the mean
and variance values of the intensity in the interrogation areas
A
1
and
A
2
,respectively.
In particular, the algorithm finds the coordinates (
x
,
y
), such that
C
(
x
,
y
)ismaximized.
The sequence of steps in image processing is also reported in Fig.
5
. The correlation
coefficient can be also calculated via the Fourier transform (Gui andMerzkirch
1998
).
Many different PIV algorithms, similar to the one presented, have been proposed
(see for example, Cenedese et al.
1994
; Stevens and Coates
1994
).
For the quality of the results, an adequate choice of the delay time
D
t
, of the sizes
of the interrogation and research areas and of the grid spacing, is very important. In
fact, the ratios
r
/
D
t
and 1/
D
t
, multiplied for the pixel width, give the maximum and
minimum velocity that the technique may resolve. Decreasing the interrogation
area, the computational requirements decrease, but the statistical reliability of the
data decreases too. To improve the resolution and the accuracy of the analysis,
techniques for determining with sub-pixel accuracy the location of the maximum
m
1
,
m
2
and
s
1
,