Geoscience Reference
In-Depth Information
h
0.125 m. Prior to and between tests, flow was maintained in the flume
(significantly below threshold for the sediment) in order to keep the 50-
m
m poly-
amide (
s
¼
1.03) PIV seeding material suspended in the flow. For each test, the bed
was initially smoothed using a sharp-edged scraper that was pulled along the flume.
With the PIV system in operation, it took at least 9 s for seed waves to be generated
after steady flow was established over the flattened bed for a given test. Detailed
measurements of granular-bed and flow dynamics were made using the PIV system
prior to and during development of waves in the sand bed for each test (Coleman
and Nikora
2009
).
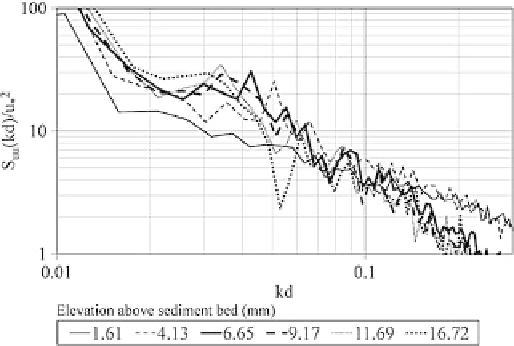
Figure
6
shows normalised single-sided autospectra of near-bed streamwise
velocities measured at selected elevations above the planar mobile bed over 10 s
immediately prior to seed-wave generation for Test B1 of the series undertaken
(Coleman and Nikora
2009
). The wavenumber spectra were calculated from
frequency spectra as
S
uu
(
kd
)/(
u
*
2
)
¼
)/(
du
*
2
)
u
e
S
uu
(
o
f
(
kd
¼
o
d
/
u
e
), where
¼
¼
k
is angular frequency, and
eddy-convection velocity
u
e
is used as the normalising flow velocity owing to the
near-bed limitation of Taylor's frozen turbulence hypothesis (e.g. Cameron and
Nikora
2008
; Coleman and Nikora
2009
). The waves first generated on the planar
bed for this test were of lengths of approximately 100 mm, i.e. of
kd
2
p
/
l
is angular wavenumber,
l
is wavelength,
o
¼
0.050. If
bedforms are generated by fluid-sediment system instabilities or turbulent fluid
motions, then increased spectral energy in the near-bed flow at about the initial bed
wavelength of
kd
¼
0.050 could be expected. Of the Fig.
6
spectra, that obtained
4.13 mm above the bed does potentially allow for a possible, albeit subtle, increase
in spectral energy at
kd
¼
0.05. Overall, however, clear peaks in Fig.
6
near-bed
spectra are not apparent at this wavenumber, suggesting that periodic bed-forms are
not generated by instabilities or turbulent events.
¼
Fig. 6 Normalised autospectra of near-bed streamwise velocities