Geoscience Reference
In-Depth Information
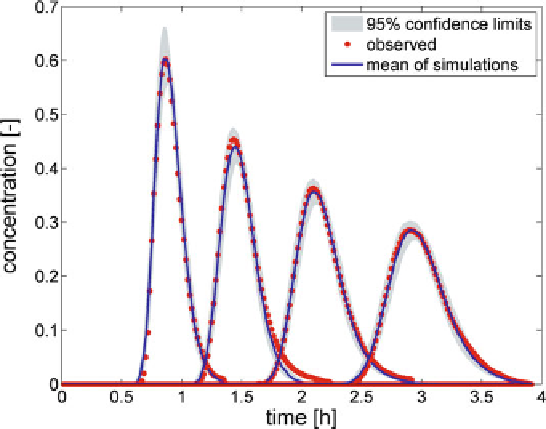
Fig. 5 Comparison of observed (
dots
) and simulated (
solid line
) concentrations of tracer at cross-
sections 2, 3, 4, and 5 with 95% confidence bounds shown as
shaded areas
4.4 Sensitivity Analysis
The sensitivity analysis (SA) aims at establishing the effect of uncertainty in model
parameters on the uncertainty of model output. Hence, the SA is very useful in
studying a model structure and in identifying sources of uncertainty (Ratto et al.
2001
; Saltelli et al.
2004
). The main objectives of the SA are: identification of
irrelevant parameters to simplify a model, identification of parameters that affect
the output in order to prioritize them in a calibration process; understand a model
structure, i.e., identify interactions between parameters (Saltelli et al.
2004
,
2008
).
In the study, a global sensitivity analysis (GSA) method based on the Sobol'
decomposition was applied. It is one of variance-based methods (ANOVA -
ANalysis Of VAriance) (Archer et al.
1997
; Sobol
2001
).
In the chapter, the GSA is presented for the maximum concentration
C
max
as the
model output and
y
i
¼
] as the model parameters. In this case, decom-
position of an output unconditional variance
V
(
C
max
) takes the following form:
[
K
x
,
A
,
A
s
,
a
V
ð
C
max
Þ¼
V
K
x
þ
V
A
þ
V
A
s
þ
V
a
þ
V
K
x
A
þ
V
K
x
A
s
þ
V
K
x
a
þ
V
AA
s
þ
V
A
a
þ
V
A
s
a
þ
V
K
x
AA
s
þ
V
K
x
A
a
þ
V
K
x
A
s
a
þ
V
AA
s
a
þ
V
K
x
AA
s
a
C
max
n
y
i
¼
y
i
Þ
where
V
i
¼
V
½
E
ð
is the first-order conditional variance (for fixed
value of
y
i
the mean of maximum concentration is calculated when other para-
meters vary. Next, the variance of results over all values of parameter
y
i
is taken).