Geoscience Reference
In-Depth Information
forms such as couloirs, which may be recognized in this figure in the regions
presented close to the slopes.
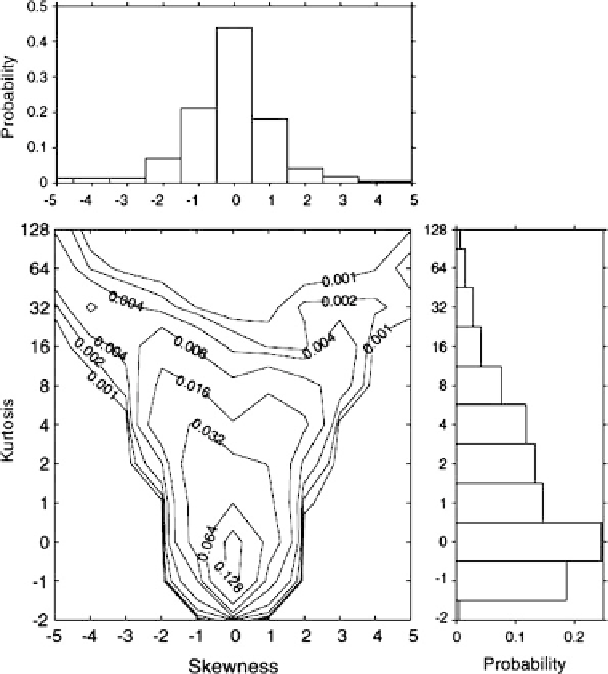
More interesting information is provided by the probability distribution
P
(Sk
z
,
Ku
z
) of the skewness and kurtosis coefficients of the Isvika surface elevation “
z
”
together with their marginal distribution:
Z
Z
P
ð
Sk
z
Þ¼
P
ð
Sk
z
;
Ku
z
Þ
dKu
z
and
P
ð
Ku
z
Þ¼
P
ð
Sk
z
;
Ku
z
Þ
dSk
z
DKu
DSk
which are presented in Fig.
5
, where D denotes integrating domain. Similar plots
have been already published in a number of studies associated with analysis of
topography of the planets (Nikora and Goring
2004
(see Fig.
6
) or Aharonson et al.
2001
); however, for the best of our knowledge, it is the first time that such figure is
presented in the relation to topography of exemplary polar region representing the
Fig. 6 The joint and marginal distribution of the cell-scale skewness and kurtosis coefficients for
Mars topography (Nikora and Goring
2004
)