Geoscience Reference
In-Depth Information
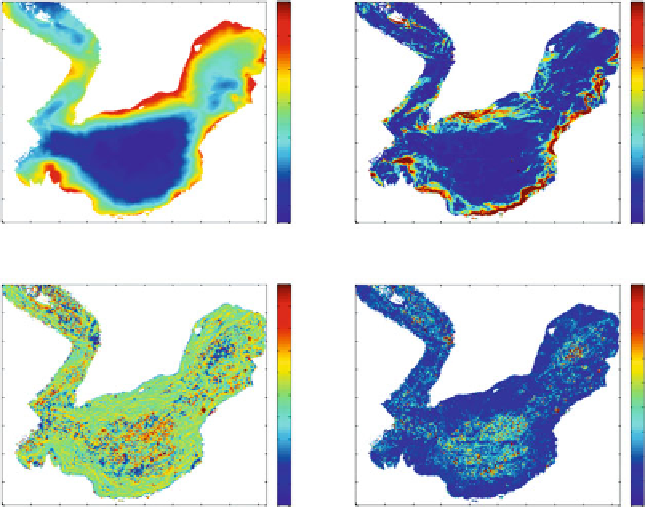
3 Results
The statistical analysis was done based on the acoustic measurements for the
10
2
), skewness
(Sk), and kurtosis (Ku) are shown in Fig.
2
. The first parameter presented in Fig.
2a
shows two distinct parts of the Isvika Bay, which are separated by an underwater
ridge. The southwestern part is three times bigger and deeper than the northeastern
one, which suggests that the processes forming the bed of smaller bay are connected
with river sedimentation rather than with glacier erosion.
However, more interesting information comes from the variance of elevation,
which is presented in Fig.
2b
. This parameter is connected with power spectrum and
may depend on the cell scale and grid size (Nikora and Goring
2004
). Because this
value gives important information about diversification of elevation, we therefore
suggest that it may be associated with gradient of slopes. In order to analyze this
relationship, the map of variance in logarithmic scale (Fig.
3a
) was compared to the
map of the slope inclination (Fig.
3b
). In contrast to Fig.
2b
, which is presented in
the real scale, the adoption of the natural logarithmic scale (Fig.
3a
) allows a clearer
10 m
2
cell scale. The maps of the mean elevation, variance (
s
a
b
x10
6
Coordinate system UTM grid [m] (Zone 33x central meridian 15
°
E)
x10
6
Coordinate system UTM grid [m] (Zone 33x central meridian 15
°
E)
8.8825
0
5
4.5
4
3.5
3
2.5
2
1.5
8.8825
8.882
8.882
-20
8.8815
8.8815
-40
8.881
8.881
-60
8.8805
8.8805
-80
8.88
8.88
8.8795
8.8795
-100
1
8.879
8.879
0.5
-120
0
5.665 5.67 5.675 5.68 5.685 5.69
mean depth
5.695
5.7
5.705 5.71
5.665 5.67 5.675 5.68 5.685 5.69
variance
5.695
5.7
5.705 5.71
x10
5
x10
5
c
d
x10
6
Coordinate system UTM grid [m] (Zone 33x central meridian 15
°
E)
x10
6
Coordinate system UTM grid [m] (Zone 33x central meridian 15
°
E)
8.8825
1
0.8
0.6
0.4
0.2
0
-0.2
-0.4
-0.6
-0.8
-1
8.8825
3
2.5
2
1.5
1
0.5
0
8.882
8.882
8.8815
8.8815
8.881
8.881
8.8805
8.8805
8.88
8.88
8.8795
8.8795
-0.5
8.879
-1
8.879
-1.5
5.665 5.67 5.675 5.68 5.685 5.69
skewness
5.695
5.7
5.705 5.71
5.665 5.67 5.675 5.68 5.685 5.69
kurtosis
5.695
5.7
5.705 5.71
x10
5
x10
5
Fig. 2 Maps of the cell-scale statistical moments of surface elevation: (a) mean, (b) variance,
(c) skewness, and (d) kurtosis