Geoscience Reference
In-Depth Information
develop; in every condition determined by weir parameters and water damming up
levels in the reservoir, this installation should work as not-submerged. Because
investigations concerned an existing object, it was important to determine the
conditions for the changes in weir work character. The spillway capacity ability
obtained based on investigations is close to that calculated, mainly from the point of
view of water quantity that under given conditions can overflow by weir, provided
that in the whole range of discharges it works as not-submerged. This corresponds
to discharge of about 385 m
3
s
1
, which could be obtained for the existing spillway
layout in plan, its crest length, weir shape, and flume parameters.
Under the conditions of Change I, for the present solutions of weir and flume, the
spillway capacity ability is lower, which results from quick changes of its operating
conditions, from not-submerged to submerged. This takes place for the discharge
equal to 125 m
3
s
1
(Fig.
10
) and the water damming up level in reservoir reaching
310.70 m asl. The maximum spillway capacity ability under these conditions was
245 m
3
s
1
at the water damming up level of 312.00 m asl, that is, the water reaches
the dam crest. After introducing Change II, a minimum improvement in the
spillway operating conditions was obtained, whereas its capacity ability was not
improved and no changes of damming up levels in reservoir were obtained. The
introduced Change III allowed the spillway operating conditions to be improved
and caused the expected changes of flow conditions in weir, which occurred at
discharge of 175 m
3
s
1
(Fig.
10
), but did not increase the expected spillway
capacity ability. It is only upon introducing Change V that the spillway capacity
ability increased to the expected 400 m
3
s
1
(Fig.
11
). This took place for water
damming up in reservoir to 312.13 m asl, which slightly exceeded the dam crest
from downstream.
Change I
Change II
Change III
Change IV
Change V
313.0
312.5
312.0
311.5
311.0
310.5
310.0
309.5
309.0
0
50
100
150
200
250
300
350
400
450
Discharge [m
3
·s
-1
]
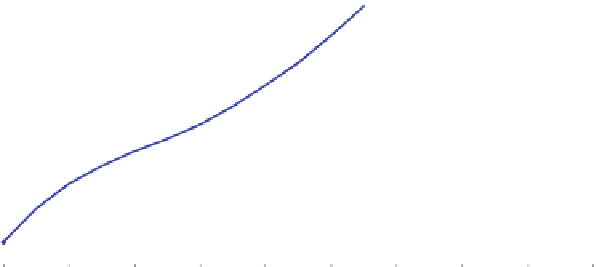
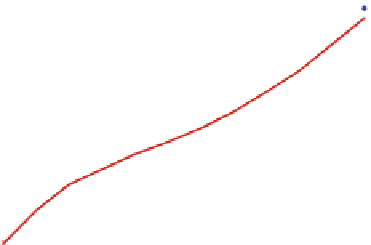
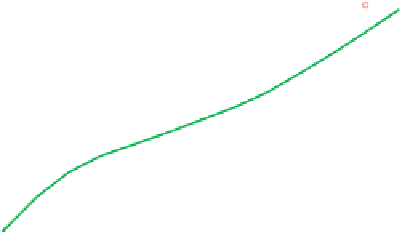
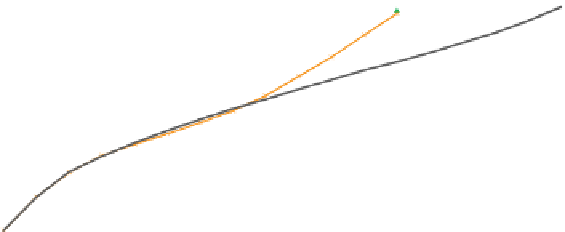
Fig. 10 Comparative hydraulic characteristics of side channel spillway for changes introduced
into the model