Geoscience Reference
In-Depth Information
evidently represent a circular motion of the fluid. The direction of motion is anticlock-
wise in flow direction, and the pivot curve of the spiral is on the left side of the channel.
Figure
3b
shows bed-load trajectories that are, as expected, similar to the near-
bed streaklines (Fig.
3a
) besides the turbulent deviations. The particle trajectories
for suspended load show conformity to the streaklines. The general conditions of
fluid motion for discharges
Q
1
/
Q
2
¼
0.2. How-
ever, because 33% of the water flows into the branch and 67% remains in the main
channel (run 2a/b: 16.7% and 83.3%, respectively) the phenomena in the bifurca-
tion are stronger, and the values of physical magnitudes are higher than in the case
Q
1
/
Q
2
¼
0.5 are the same as for
Q
1
/
Q
2
¼
0.2. Figure
3c
shows the streaklines in the bed region and just under the
water surface. All streaklines that enter the branch on the bottom go up strongly
at the left wall and at the right wall of the branch under water surface level. The
difference in streaklines at the bottom and at the top indicates that the water does
not flow into the branch from a rectangular part of the cross section.
Table
1
shows the sediment transport ratio S
1
/S
2
for runs 2a to 2d. Apparently,
for the suspended load problem (run 2b), this ratio nearly equals the discharge
ratio
Q
1
/
Q
2
, whereas for the bed-load problem (2a) this ratio is about twice as
high. The ratios
S
1
/
S
2
for run 2c and 2d again indicate the sediment is practically
proportionally distributed in the suspended load case (run 2d), in contrast to the
bed-load case (run 2c). In run 2c, more than half of the bed-load material flows
into the branch, while only a third of the water is extracted. Figure
5
shows an
Table 1 Ratio of sediment distribution for different conditions
Channel
run
Angle of diverting
branch (
)
S
1
/
S
2
Q
1
/
Q
2
¼
0.2
Q
1
/
Q
2
¼
0.5
(a)
D
(b)
D
(c)
D
(d)
D
¼
0.15 mm
¼
0.01 mm
¼
0.15 mm
¼
0.01 mm
2
90
0.425
0.219
1.213
0.542
3
45
0.280
0.205
0.781
0.541
4
135
0.378
0.214
0.932
0.531
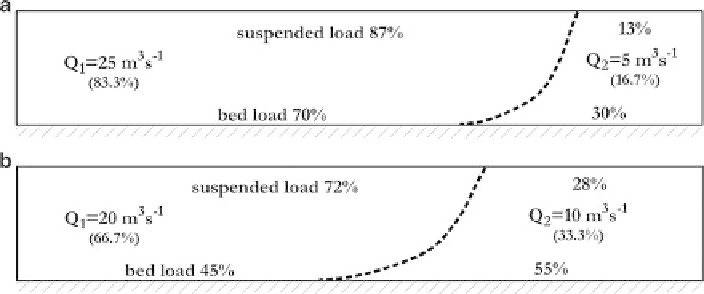
Fig. 5 Part of upstream cross section that flows into the branch for channel 2 for discharges:
(a)
Q
1
/
Q
2
¼
0.2 and (b)
Q
1
/
Q
2
¼
0.5