Geoscience Reference
In-Depth Information
Thus, considering the velocity component in the
x-
direction (
V
x
) as a discrete
random variable of
N
number of measurements, its expected value is estimated as:
N
X
N
1
E½V
x
¼m
V
x
¼
V
a
(7)
a¼
1
where
V
a
is the instantaneous velocity measurement, and
m
represents the variable's
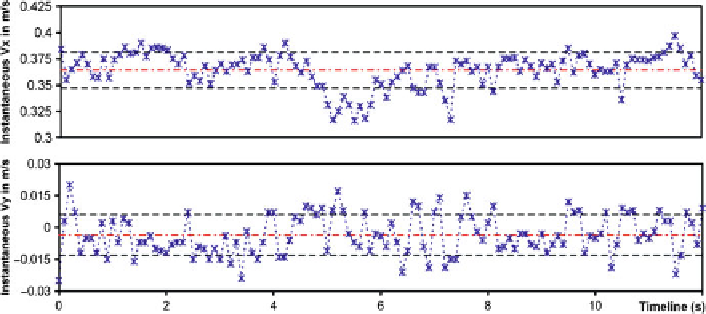
mean. Figure
4
depicts one of many of the
V
x
and
V
y
time-series that were taken at
the laboratory. In the same figure, the mean (red dot-dashed line)
the standard
deviation (blue dashed lines) are shown as well.
The second statistical moment or
variance
is defined in the same way based on
the expectation theory as shown below (Reeve
2010
):
2
s
2
variance
¼
E
½ð
V
mÞ
¼
(8)
The first statistical moment is probably the most popular measurement of central
tendency; the second statistical moment is useful to know the dispersion of the
random variable while the third (skewness) and fourth (kurtosis) moments describe
the shape of the density function (Reeve
2010
). The
kurtosis
(9) and
skewness
(10)
are defined as well based on the expectation theory as follows:
h
i
3
E
ð
V
mÞ
skewness
¼
(9)
s
3
h
i
4
E ðV mÞ
kurtosis
¼
3
(10)
s
4
10 dm
3
s
1
)
Fig. 4
V
x
and
V
y
time-series at
X
¼
1.00 m,
Y
¼
0.25 m, and
Z
/
H
¼
0.5 (
Q
¼