Geoscience Reference
In-Depth Information
0.2
0.2
0.19
0.19
0.18
0.18
0.17
0.17
0.16
0.16
0.15
0.15
0.14
0.14
0.13
−
0.1 0
0.13
−
0.1 0
0.1 0.2
0.3 0.4
0.5 0.6 0.7
0.1 0.2
0.3 0.4
0.5 0.6 0.7
u
(m/s)
u
(m/s)
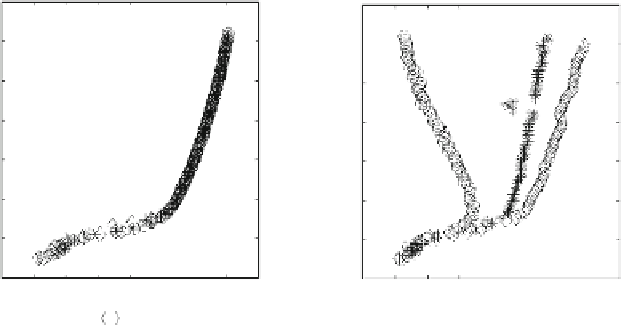
Fig. 14 Logarithmic profile in an open-channel flow with a gravel bed (discharge
Q ¼
19.2 I/s).
Left
: results of adaptative correlation.
Right
: results of cross-correlation. Sensitivity to the size of
the interrogation area,
circles
:16
16 pixels;
asterisks
:32
32 pixels;
diamonds
:64
64
pixels
5
10
15
20
25
30
5
1
0.8
0.6
0.4
0.2
40
10
15
20
25
30
30
30
35
20
10
15
20
25
10
5
0
0
5 0 5 0 5 0
5 0 5 0 5 0
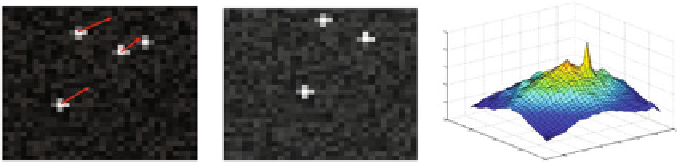
Fig. 15
Left
: first PIV image and in-plane movement.
Center
: second image.
Right
: corresponding
correlation plot. Noise peak is dominated by the true peak. Interrogation area is 32
32 pixels
5
10
15
20
25
30
5
1
0.9
0.8
0.7
0.6
0.5
0.4
0.3
0.2
40
10
15
20
25
30
30
35
10
15
20
25
30
20
10
5
0
5 0 5 0 5 0
5 0 5 0 5 0
0
Fig. 16
Left
: first PIV image and in-plane movement.
Center
: second image.
Right
: corresponding
correlation plot. Noise peak dominates the true peak because there is too much loss of information
between first and second image. Interrogation area is 32
32 pixels
out-of-plane losses. The information loss is too large, and the noise peak
dominates the true peak. The corresponding vector would be approximately
zero, exemplifying bias-to-zero. However,
too short
intervals may reduce