Environmental Engineering Reference
In-Depth Information
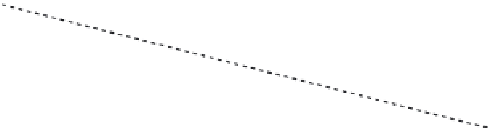
9,000
Wind capacity
6,000
SNSP = 0.70
3,000
0
8,760
Duration (h)
Figure 5.37
Annual load duration characteristic
Chronological demands, such as those shown in Figure 5.2, may be plotted in
descending order of magnitude, as shown in Figure 5.37. Demands over a 1 year
period plotted in this way result in the annual load-duration characteristic. The
heavy line is a linear approximation of the characteristic, ignoring the extreme peak
loads at the left and the very lowest demands on the right. The average demand,
based on the linear approximation, is 6,000 MW, and the load factor (ignoring the
extremes) is 0.667.
Suppose we wish to achieve a wind energy penetration of 30 per cent, and
that the wind sector as a whole has a capacity factor of 0.30. We therefore require
6,000 MW of wind capacity, giving average wind generation of 2,000 MW,
or 30 per cent of the average demand as required. However, Figure 5.37 illustrates
a difficulty with this argument - for half of the time the wind capacity exceeds the
demand, and some wind energy will have to be curtailed. If more wind capacity is
built, the 30 per cent target may be reached, but with an even greater proportion of
the potential wind generation being wasted. Developers would be unwilling to
invest in more wind capacity in this situation. (Unfortunately, some jurisdictions
pay for curtailed wind, which transfers the cost of economically unsound wind
power developments to the consumer.)
The situation is actually worse than described above. TSOs may limit the
system non-synchronous penetration (
SNSP
) - renewable, mostly wind generation -
that may supply demand, by requiring that (McGarrigle, 2012)
wind power
þ
HVDC imports
demand
þ
HVDC exports
SNSP
¼


Search WWH ::

Custom Search